- Joined
- Jul 23, 2019
- Messages
- 484
- Likes
- 513
The fidelity-online.de measurements of the B&W 800 D3 are interesting, especially as a result of their extensive nature. However, aspects of the assessments aren't entirely clear. I'd imagine that if they were to measure the B&W 800 D4 then nominally similar comments would result.
For example, the spectrogram of the B&W 800 D3, which is a loudspeaker costing around €30,000, is described as having an almost perfect decay behavior. This is considered to be due to the "special membranes of the B&W drivers and the design of the housing that can show their qualities. The decay behavior is almost perfect. There are virtually no resonances, not even at the highest frequencies."
But are those driver membranes all that special? Moving to the review of the KEF Reference 1 (fidelity-online.de), which is a loudspeaker costing about €6,000, we get a very similar, if not better, spectrogram than that produced by the much more expensive 800 D3. Their spectrograms are compared below.
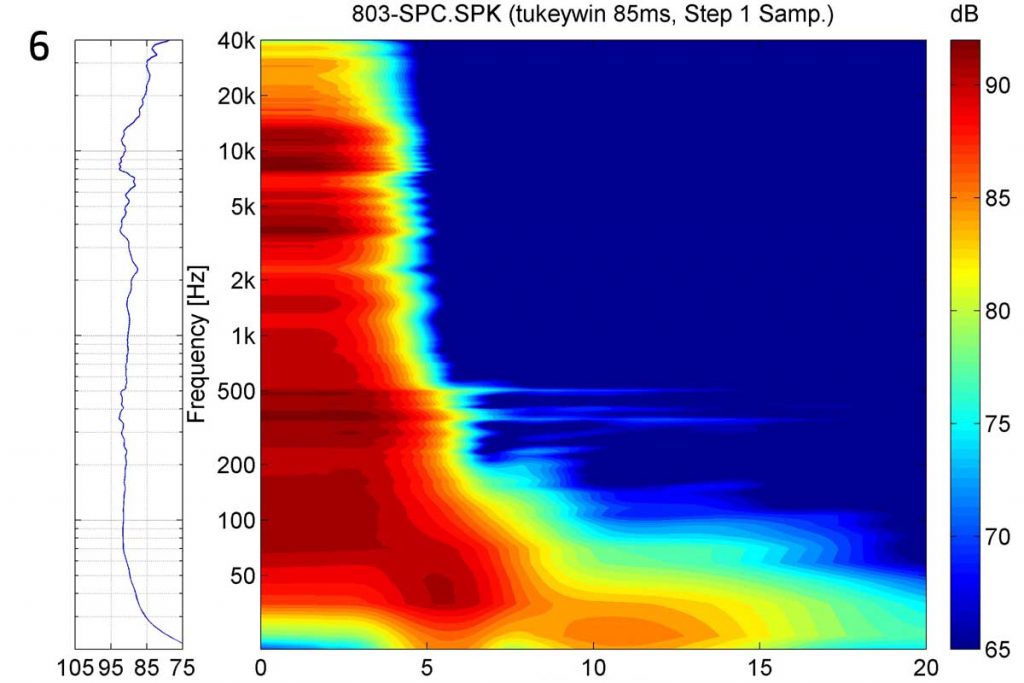

Is the 800 D3 really state-of-the-art in this respect, considering that it involves a price premium of €24,000? The review of the Reference 1 comments that "the decay behavior of the Reference 1 is almost perfect. The few barely visible small resonances hardly need mentioning and could arise from the natural frequencies of the housing volumes. Partial vibrations of the diaphragms seem to be a completely foreign word for the mid-high unit." This seems to be more or less entirely equivalent to the description accompanying the 800 D3 spectrogram.
In fact, it appears that the differences in their respective spectrograms arise from the differences in their frequency response curves caused by the locations and the intensities of peaks and dips. If no peaks or dips were present, then could we not assume that we would get a much better spectrogram for the dynamical system under test (the loudspeaker)?
Hence, it would be very interesting to be able to see the calculated spectrogram of a simulated loudspeaker system that has a very flat, if not perfectly flat, frequency response, would it not? This would serve as a reference for comparison purposes – the ideal behaviour that no passive loudspeaker system could match. Of course, for a high quality comparison to be achievable and more meaningful, the simulated loudspeaker would need to have its frequency response appropriately tailored to match the real loudspeaker to which it would be compared.
For example, the spectrogram of the B&W 800 D3, which is a loudspeaker costing around €30,000, is described as having an almost perfect decay behavior. This is considered to be due to the "special membranes of the B&W drivers and the design of the housing that can show their qualities. The decay behavior is almost perfect. There are virtually no resonances, not even at the highest frequencies."
But are those driver membranes all that special? Moving to the review of the KEF Reference 1 (fidelity-online.de), which is a loudspeaker costing about €6,000, we get a very similar, if not better, spectrogram than that produced by the much more expensive 800 D3. Their spectrograms are compared below.
Is the 800 D3 really state-of-the-art in this respect, considering that it involves a price premium of €24,000? The review of the Reference 1 comments that "the decay behavior of the Reference 1 is almost perfect. The few barely visible small resonances hardly need mentioning and could arise from the natural frequencies of the housing volumes. Partial vibrations of the diaphragms seem to be a completely foreign word for the mid-high unit." This seems to be more or less entirely equivalent to the description accompanying the 800 D3 spectrogram.
In fact, it appears that the differences in their respective spectrograms arise from the differences in their frequency response curves caused by the locations and the intensities of peaks and dips. If no peaks or dips were present, then could we not assume that we would get a much better spectrogram for the dynamical system under test (the loudspeaker)?
Hence, it would be very interesting to be able to see the calculated spectrogram of a simulated loudspeaker system that has a very flat, if not perfectly flat, frequency response, would it not? This would serve as a reference for comparison purposes – the ideal behaviour that no passive loudspeaker system could match. Of course, for a high quality comparison to be achievable and more meaningful, the simulated loudspeaker would need to have its frequency response appropriately tailored to match the real loudspeaker to which it would be compared.
Last edited:


")