• WANTED: Happy members who like to discuss audio and other topics related to our interest. Desire to learn and share knowledge of science required. There are many reviews of audio hardware and expert members to help answer your questions. Click here to have your audio equipment measured for free!

Does Phase Distortion/Shift Matter in Audio? (no*)

gnarly

Major Contributor
Joined
Jun 15, 2021
Messages
1,061
Likes
1,499
I think FIR designer and Crosslite+ are really good commercial software packages... beggars (like moi) can't be choosers, however!

Yeah, I hear you. If I hadn't got so tired of all the manual work/time it took with rePhase, on my 4 & 5 way DIY unity/synergy speakers doing each driver section-by-section,
I'd still be with "rePhase only" ....just for saving some $$.

It probably is worth noting though, for folks wanting a rather easy to use, but still very powerful FIR generator, Eclipse Audio has two versions both for less money than either Acourate or AudioLense.
Above those versions is gets pricey however, and I must admit I don't like the business model for those versions, which I feel creates a need for ongoing subscriptions.

Crosslite+ is more of a new toy for me than anything. It does some really cool stuff. Allows virtual speaker tuning, and can automatically locate both impulse peaks (like most all measurement software, as well as impulse initial rise (which I find killer helpful for IIR work).
Quasi-anechoic speaker measurements and FIR have become as big a part of the hobby as the actual speaker building.


I am really convinced phase matters. Setting audibility aside, I think paying attention to it makes for more refined basic frequency response spinoramas.
And I personally think phase does have audible effects, more so in the lower frequency range. Hence, enjoy the comments of j.j. and others giving ways to test/experiment.

Anyway, probably wrong thread for my 2c on FIR generators....I'll get back to, and stick to, PHASE :)
 

Keith_W

Major Contributor
Joined
Jun 26, 2016
Messages
2,806
Likes
6,446
Location
Melbourne, Australia
How, tell me, far do you think a correction for one point in a soundfield at 1kHz applies? How far can you move from that point and still have meaningful correction.

That is, assuming that you correct pressure. But you have to pick something out of those 4 variables at one point, and most choose pressure.

Now, critical bands mentioned above, I would prefer you use a more modern understanding, including using ERB's instead of critical bands, and, well, I'd add some discussion to the wiki if somebody stuck in 1955 wouldn't just remove it again. BUT yes, the fact that ERB's are reasonably estimated as 40Hz wide until you get to the point that 1/4 octave is wider than 40 hz, at which case it becomes about 1/4 octave, yes, that does imply that too too too narrow correction, even if it was possible (breathe out and your correction is wrong, for instance) at high frequencies is pointless.

Thanks for weighing in, JJ. I seemed to recall that critical bands had something to do with it, and I looked up my source. In F. Alton Everest's "Master Handbook of Acoustics" Ch. 10, there is a section "Comb Filters and Critical Bands" where he says:

"One way to evaluate the relative audibility of comb filter effects is to consider the critical bands of the human ear. The critical bandwidths at representative frequencies are shown in Table 10-1. The bandwidths of the critical bands vary with frequency. For example, the critical bandwidth of the human ear at 1kHz is about 128Hz. A peak-to-peak comb filter frequency of 125Hz corresponds to a reflection delay of about 8msec, which corresponds to a difference in path length between the direct and reflected components of about 9ft. [...] These examples tend to confirm the observation that in large spaces (long delays) comb filters are inaudible, whereas they often are very troublesome in small spaces (short delays). Also, critical bands are much narrower at low frequencies, suggesting that comb filter effects are more audible at low frequencies".

And in Ch. 4, under "Loudness and Bandwidth:

"Research shows how the width of the critical bands varies with frequency. In particular, critical bands become much wider at higher frequencies. There are other methods for measuring critical bandwidth, they provide different estimates particularly below 500Hz. For example, the equivalent rectangular bandwidth (ERB) that applies to young listeners at moderate sound levels is based on mathematical methods. The ERB offers the convenience of being calculable from the equation ERB = 6.23f^2 + 93.3f + 28.52Hz where f = frequency in kHz".

My copy is the 7th Edition.

I have seen you talk about ERB's before, and I did look it up. I also read up about the BARK scale. Everest seems to imply that (1) ERB is another way to look at critical bandwidth, and (2) critical bands are wider at high frequencies. I took this to mean that we should not correct in high resolution at high frequencies.

Whilst I am aware that ERB's, BARK, and Critical Bandwidth all roughly describe the same thing, I do not know which has the most scientific support. I am not as well informed as you (and I say this humbly and with respect), so I just went with what my book said. And yes I know I don't need to quote the book to you, I am typing it for the benefit of other ASR members who may not own a copy of the book.

This is not a short discussion, but yes, above about 250Hz or so (this has nothing to do with the so-called Schroder frequency, btw, it has to do with head size vs. wavelength) it's quite difficult to even correctly do an "exact correction". For which ear, maybe, pick ONE? This does mean that you should flatten the spectrum you measure BEFORE you calculate the correction filter. How much you smooth is not a short discussion, either.

The wavelength of 250Hz is 137cm. The typical human head width is 18cm. How are the two correlated?
 

pma

Major Contributor
Joined
Feb 23, 2019
Messages
4,685
Likes
10,946
Location
Prague
The wavelength of 250Hz is 137cm. The typical human head width is 18cm. How are the two correlated?
D/lambda = 1/8 approx. Just my guess. Head sound field diffraction.
 
Last edited:

markus

Addicted to Fun and Learning
Joined
Sep 8, 2019
Messages
712
Likes
825
You could just measure the relevant neighbouring points and discover what the variation is…

MMM or spatial averaging could help assist as well.
Not really because none of these measurements tell us what we actually perceive.
Normally, the phase (thinking more of absolute phase here) shouldn’t really change much with the influence of the room — with the exception of a few areas where there is particularly sparse, strong modal and boundary influences. And when measuring at the far edges of the speakers’ beam width range or pattern control.
? Absolute phase = polarity inversion? Acoustically that's not happening. Phase response of the steady state? A windowed version? What kind of window and why?
As for the head and torso, well, I think the brain compensates the effect of your own body so I’m not sure why it would matter all that much.
Phantom imaging is different from perception of natural sounds: http://decoy.iki.fi/dsound/ambisonic/motherlode/source/Stereo microphone techniques_arethe purists wrong_Lispshitz_1986_pt1.pdf
 
Last edited:

OCA

Addicted to Fun and Learning
Forum Donor
Joined
Feb 2, 2020
Messages
719
Likes
561
Location
Germany
@OCA would you mind jumping in, they are talking about you :)
I was a bit busy running errands today ;)
Thanks, Keith...I had no idea (or totally forgot, maybe?) hat @OCA participated here. I originally just found his videos via a sidebar suggestion on YouTube, which I assume showed up when I was viewing manufacturer videos on room correction gear.

I'm an engineer, but a chemical engineer, so I have minimal grasp of the basics of wave phenomena from physics, but not much beyond that. It's closing in on 50 years since I had controls theory, taught from a process point of view, and spoke in terms of lags and used Laplace transforms, not of phase or Fourier transforms. When we asked the prof to explain what the hell the S domain was supposed to be, he essentially gave up and said "trust me, it works, you get to do complex calculations using simple algebra." Then we learned in the lab that all our efforts to model processes and lags in the real world didn't give us better results than simply following cookbook procedures to adjust real-world analog controllers, which deviated from ideal action themselves, to do their best on real-world processes and variables.. Hence, I never again opened that controls theory book in 35+ years in industry.

Unlike electrical engineers, we didn't have any previous coursework in complex number math. All I know is my EE friends made jokes about Poles (with a capital P) and planes.

Last time I attempted to follow OCA's procedure was before I had to totally rearrange this room to accommodate boxes full of belongings to a family member back here on a temporary basis, so my measurements from before are no longer representative. That's why I am curious about any results from other members who've tried the latest suggestions before I dive in again.
Audyssey videos are all "major" improvements over the automated calibration not necessarily because of the efficiency of the methods but because standard Audyssey calibration leaves a lot to be improved including but not limited to absurd averaging of multiple mic point measurements, wrong alignment logic of subwoofer to the rest of the speakers, measuring and correcting for an absurd target with major high frequency roll off at 75dB but then applying dynamic boost up to 115dB, boosting surround speakers an extra 6dB, etc. However, my Audyssey methods also improved over time along with new additions to REW. The most recent Audyssey method includes automation scripts that bypass Audyssey correction completely and manipulate its FIR filters for inserting the custom filters you create in REW. But most of them require MultEQ Editor app to achieve that and I don't think 2010 Onkyo can use MultEQ Editor app so, that will be a problem.

The latest video you linked above in this threat introduces a brand new inversion technique. It's not inverting below Schroeder's that it differs at. It inverts the min phase version of the speaker response and the inversion is used as convolution filter "as is". The logic behind it is simple, "only min phase is invert-able". Older inversion methods inverted the response and then generated min phase version of the inversion filters. This difference results in significant improvement as it automatically corrects excess phase from both speaker responses at the LP as much as possible without artifacts. It takes the guess work out of excess phase removal. I've put a lot of effort in optimizing it. It's only down side is that, the inversion needs to be very accurate and proper inversion of the FFT requires a lot of zero padding so it needs LOTS of FIR taps (131k minimum in my experience) otherwise some pre-echo might occur.

In the video tutorial, I have detailed all the reasons for not correcting beyond the room transient frequency based on measurements taken with an omni-directional mic unless you have really bad speakers. HF directionality is not my idea, it's a well established scientific fact (Dr Toole for one, is very clear in his research about avoiding it at all costs) and there is a lot of recent work for properly measuring HF with spherical 3D microphone arrays and correcting directional HF response by using eigenvectors.

I can't comment much on how good this method's results are. But, I only post a tutorial video if I consistently get good results with it not only from my system but also from others. I receive about 5-10 REW mdat or Audyssey ady files a day from viewers asking for filter creation so I have the ability to get my methods tested in other systems. Still, it's notoriously difficult to establish one common method that will work great in every room with every system. But this method gets pretty close IMO, totally free and it literally takes less than 5 minutes to complete. One wouldn't lose anything by giving it a try in much less time than it takes investigating all of its aspects beforehand. If you check, viewer comments under the videos also generally attest to the dramatic improvements they've experienced.
 
Last edited:

OCA

Addicted to Fun and Learning
Forum Donor
Joined
Feb 2, 2020
Messages
719
Likes
561
Location
Germany

ernestcarl

Major Contributor
Joined
Sep 4, 2019
Messages
3,117
Likes
2,340
Location
Canada
Not really because none of these measurements tell us what we actually perceive.

? Absolute phase = polarity inversion? Acoustically that's not happening. Phase response of the steady state? A windowed version? What kind of window and why?

Phantom imaging is different from perception of natural sounds: http://decoy.iki.fi/dsound/ambisonic/motherlode/source/Stereo microphone techniques_arethe purists wrong_Lispshitz_1986_pt1.pdf

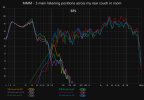
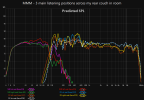
Well, it may not tell you exactly what you perceive, it does indicate what the pressure average is across a given area where the listener would be sitting in.

I may be confusing terms here, but when I mentioned absolute phase what I mean was the actual native phase response of the speaker minus the room. *As to what windowing and/or smoothing works best, I dunno — just try what you can and test out the results for yourself.

Phantom imaging and microphone techniques were not brought up anywhere in my response.
 

ernestcarl

Major Contributor
Joined
Sep 4, 2019
Messages
3,117
Likes
2,340
Location
Canada
Do you know if this is MAC compatible? Someone here in ASR was asking me earlier for a Mac version of rePhase.

I’ve seen it in live action in some videos, but never really thought about or remember the OS used. Sorry.
 

markus

Addicted to Fun and Learning
Joined
Sep 8, 2019
Messages
712
Likes
825
Well, it may not tell you exactly what you perceive, it does indicate what the pressure average is across a given area where the listener would be sitting in.
Why do you think the pressure average is helpful? I think we need to do the opposite and start measuring the directional components of the sound field.
I may be confusing terms here, but when I mentioned absolute phase what I mean was the actual native phase response of the speaker minus the room. *As to what windowing and/or smoothing works best, I dunno — just try what you can and test out the results for yourself.
I did and still do but it's of limited value and therefore not relevant to what JJ and I were discussing.
Phantom imaging and microphone techniques were not brought up anywhere in my response.
But in mine because the difference is very important to understand in the context of room equalization.
 
Last edited:

ernestcarl

Major Contributor
Joined
Sep 4, 2019
Messages
3,117
Likes
2,340
Location
Canada
Why do you think the pressure average is helpful?

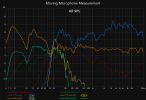
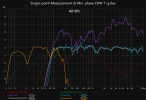
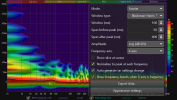
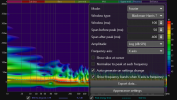
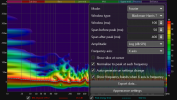
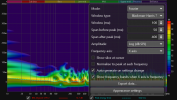
It can be used as reference for EQ:

Desk position:
1707858790603.png 1707858794155.png 1707859870678.png 1707859875647.png

Couch positions:
1707858862348.png 1707858866749.png 1707859914689.png 1707859909611.png

*Not the only reference, but as an additional one.

I think we need to do the opposite and start measuring the directional components of the sound field.

I am already aware that it is important as well. But, one is limited with a single capsule omni mic.

I did and still do but it's of limited value and therefore not relevant to what JJ and I were discussing.

Then, never mind what I said if it is of no relevance to what you think matters there.
 
Last edited:

j_j

Major Contributor
Audio Luminary
Technical Expert
Joined
Oct 10, 2017
Messages
2,326
Likes
4,852
Location
My kitchen or my listening room.
Ok, ERB's are a modern take on critical bands/barks. Barks came from Sharf's work, done BY HAND. You have to admit that's a crapload of hard work. More modern understanding of filters created the "ERB scale". An ERB is basically the bandwidth that has (if flat) equal energy to the actual filter centered on that area.

The difference is that ERBs are pretty much invariant to masking, whereas Critical Bands/Barks <they are effectively the same> do not have invarient masking properties, i.e. the required masking SNR for a tone varies with frequency.

To the question of "how far does it fall apart once you move from the point of measurement" it's very dependent on the listening space.
 

markus

Addicted to Fun and Learning
Joined
Sep 8, 2019
Messages
712
Likes
825
Ok, ERB's are a modern take on critical bands/barks. Barks came from Sharf's work, done BY HAND. You have to admit that's a crapload of hard work. More modern understanding of filters created the "ERB scale". An ERB is basically the bandwidth that has (if flat) equal energy to the actual filter centered on that area.

The difference is that ERBs are pretty much invariant to masking, whereas Critical Bands/Barks <they are effectively the same> do not have invarient masking properties, i.e. the required masking SNR for a tone varies with frequency.
Schnupp describes the current model as a "biological FFT" with frequency resolution vs. time resolution tweaked by evolution. It massively reduces and filters the vibrations reaching our eardrums before our brain gets to process the input. A mic picks up more information and software like REW can show the data in useful ways but also in ways that are completely irrelevant to what we're after. Is this model accurate (enough)? Does it help in defining what can and should be corrected and to what extend?
To the question of "how far does it fall apart once you move from the point of measurement" it's very dependent on the listening space.
How so? I think we can agree that we're exclusively talking about acoustically small rooms as defined by Toole.
 
Last edited:

j_j

Major Contributor
Audio Luminary
Technical Expert
Joined
Oct 10, 2017
Messages
2,326
Likes
4,852
Location
My kitchen or my listening room.
Schnupp describes the current model as a "biological FFT" with frequency resolution vs. time resolution tweaked by evolution. It massively reduces and filters the vibrations reaching our eardrums before our brain gets to process the input. A mic picks up more information and software like REW can show the data in useful ways but also in ways that are completely irrelevant to what we're after. Is this model accurate (enough)? Does it help in defining what can and should be corrected and to what extend?

How so? I think we can agree that we're exclusively talking about acoustically small rooms as defined by Toole.

It's nothing like an FFT, more like a biological implementation of a travelling-wave filter, but of course "not quite". The impulse response of each part varies with the bandwidth of the ERB, of course. The ERB ( bear in mind that one can define an ERB around any point (ditto critical bands/barks), and there are many inner hair cells in a bandwidth, but each inner hair cell has its own center frequency, starting from the entrance of the cochlea (highest frequencies) and finishing at the tip (low frequencies). The actual frequency response of the lowest is also intermingled with phase-locking. High frequencies detect the envelope of attacks instead of the individual waveform in that filter bandwidth as far as "leading edges".

You should go listen to the whole "Hearing 099" tutorial I did a number of years ago shown at www.aes.org/sections/pnw in the "recap" tab. This would, I think, answer many of your questions at one time.

As to how fast does the measurement go wonky? That depends intensely on early reflections, no matter what kind of room, and in small rooms the wall dispersion as well. Yeah, I know, that's not terribly helpful. Best to measure it.
 

markus

Addicted to Fun and Learning
Joined
Sep 8, 2019
Messages
712
Likes
825
It's nothing like an FFT, more like a biological implementation of a travelling-wave filter, but of course "not quite". The impulse response of each part varies with the bandwidth of the ERB, of course. The ERB ( bear in mind that one can define an ERB around any point (ditto critical bands/barks), and there are many inner hair cells in a bandwidth, but each inner hair cell has its own center frequency, starting from the entrance of the cochlea (highest frequencies) and finishing at the tip (low frequencies). The actual frequency response of the lowest is also intermingled with phase-locking. High frequencies detect the envelope of attacks instead of the individual waveform in that filter bandwidth as far as "leading edges".

You should go listen to the whole "Hearing 099" tutorial I did a number of years ago shown at www.aes.org/sections/pnw in the "recap" tab. This would, I think, answer many of your questions at one time.
I did listen to that but obviously none of my questions have been satisfactorily answered. Maybe I'm just too dense or maybe the answers aren't know (yet). The current state of the art in room correction seems to support the latter. They are all solutions to a mathematical problem, not necessarily based on solving a specific psychoacoustic problem.
As to how fast does the measurement go wonky? That depends intensely on early reflections, no matter what kind of room, and in small rooms the wall dispersion as well. Yeah, I know, that's not terribly helpful. Best to measure it.
Measuring alone won't get us far. Proper controlled listening tests are required that's why I asked if you know of any specific scientific studies. I don't know any and I do know the whole AES literature on small room acoustics...
 

j_j

Major Contributor
Audio Luminary
Technical Expert
Joined
Oct 10, 2017
Messages
2,326
Likes
4,852
Location
My kitchen or my listening room.
I did listen to that but obviously none of my questions have been satisfactorily answered. Maybe I'm just too dense or maybe the answers aren't know (yet). The current state of the art in room correction seems to support the latter. They are all solutions to a mathematical problem, not necessarily based on solving a specific psychoacoustic problem.

Physics is much of the problem in room correction, and the math is also problematical, the next line is a big part of the problem.

Measuring alone won't get us far. Proper controlled listening tests are required that's why I asked if you know of any specific scientific studies. I don't know any and I do know the whole AES literature on small room acoustics...

If the "correction solution" does not hold where the ears are, you're really chasing rainbows, I think. Different approaches for different frequencies. Using a multichannel soundfield capture can also be informative, and of course, when an individual head gets dropped into the middle, that means understanding volume velocity as well.

No, it's not simple to even measure. Listening tests really don't start until you can tell what you're dealing with in terms of soundfield.
 

OCA

Addicted to Fun and Learning
Forum Donor
Joined
Feb 2, 2020
Messages
719
Likes
561
Location
Germany
I don't think the math is too far behind the evolution. Apple's "spatial audio" dynamic head tracking works quite effectively for example.
 

markus

Addicted to Fun and Learning
Joined
Sep 8, 2019
Messages
712
Likes
825
Physics is much of the problem in room correction, and the math is also problematical, the next line is a big part of the problem.


If the "correction solution" does not hold where the ears are, you're really chasing rainbows, I think. Different approaches for different frequencies. Using a multichannel soundfield capture can also be informative, and of course, when an individual head gets dropped into the middle, that means understanding volume velocity as well.

No, it's not simple to even measure. Listening tests really don't start until you can tell what you're dealing with in terms of soundfield.
I see. Still lots of blind spots. How to explore? Use binaural capturing and trial-and-error?

Another aspect we didn't quite touch is how does stereo even work or how do we want it to work in terms of psychoacoustics. It's obviously not a binaural reproduction technique (there is crosstalk and some say it works because of crosstalk) although it can provide binaural cues. Toole reported that listening to an ambisonic recording under anechoic conditions produced a headphone-like "within the head" perception. The expectation was to hear something equivalent to a natural sound field though. Why didn't that work? Can we even think about digital room correction without understanding fundamental mechanisms of how recording and reproduction techniques affect our hearing?
 
Last edited:

markus

Addicted to Fun and Learning
Joined
Sep 8, 2019
Messages
712
Likes
825
I don't think the math is too far behind the evolution. Apple's "spatial audio" dynamic head tracking works quite effectively for example.
That's just a simple matter of applying HRTFs in relation to head position. It's an engineering task but there is no deeper understanding in how our hearing works on the other side of the eardrum.
 

OCA

Addicted to Fun and Learning
Forum Donor
Joined
Feb 2, 2020
Messages
719
Likes
561
Location
Germany
That's just a simple matter of applying HRTFs in relation to head position. It's an engineering task but there is no deeper understanding in how our hearing works on the other side of the eardrum.
I agree but it still sort of shows that at least the math has figured how the brain interprets information received from both ears in terms of locating sound sources in 3D.

I don't think there is too much space left for improvement in DRC through conducting statistically significant blind listening tests. A person's ability to express what he hears is a major limit on the accuracy math requires. But sooner or later, AI will decode the intricate neural signatures linked to different genres, moods, and musical elements mapping the brain's response to various musical stimuli and developing algorithms capable of replicating these patterns allowing for the transmission of musical signals directly into neural circuits responsible for auditory perception and emotional response. In this scenario, the need for traditional audio devices such as speakers, amps, headphones and DRC will all become obsolete.
 

theREALdotnet

Major Contributor
Joined
Mar 11, 2022
Messages
1,233
Likes
2,129
Take any music track of your choice.
Calculate its frequency spectrum.

The frequency spectrum of a music track? How, with an FFT length of 8 million or something? Are you thinking perhaps of a histogram, where many short-length spectra are added together? Not only doesn’t that usually show phase information – it doesn’t have phase information.

My favourite demo of why you ignore phase at your own peril is at the bottom of this short Purifi article:
 
Top Bottom