
<Reproduced and expanded from the original 11/2/2012 article.>
Amplifier clipping has been cited as the cause of audible distortion, destruction of speakers (especially tweeters), and total annihilation of the known universe. More or less. In fact, clipping does cause distortion that adds significant high-frequency content not in the original signal, and does present higher power to the speaker. But perhaps less that you might expect, at least in some cases…
To address power first, a pure sine wave (undistorted signal) with peak amplitude A has an RMS value of A/sqrt(2) or 0.7071*A. A heavily clipped sine wave approximates a square wave, and thus has RMS value of A, about 30% higher. Assuming voltage is clipped, the square wave has twice the power of the pure sine wave since power is related to voltage squared. That is, a heavily clipped signal puts up to twice the power into the speaker as an unclipped signal of the same (peak) amplitude. Less-clipped signals will not have as large a power increase, naturally.
We already know square waves can be made from a series of sine waves (see related thread), thus clipping must add higher frequency content to create those sharply flattened peaks. An ideal square wave adds odd harmonics in proportion to their harmonic number, e.g. the third harmonic is at 1/3 the voltage of the fundamental, the fifth is at 1/5 the voltage, and so on. Remember power goes as voltage squared, so in terms of power the third harmonic is 1/9 the power of the fundamental, the fifth harmonic is at 1/25, etc. Power dies out pretty rapidly and is one of the common counter arguments to clipping “blowing up” speakers.
The figure below shows a pure 100 Hz sine wave. The signal is sampled at 4 MS/s but is not otherwise quantized (i.e. no explicit DAC; the math program’s resolution is about 38 bits for this example). The signal is 2 Vpp, or about 0.707 Vrms. Note cliplevel = 0 % means no clipping and so the ideal and “clipped” signals are identical in the top plot. The spectral diagram (FFT) shows the resulting frequency content up to 1 MHz, and includes the calculated SINAD (signal to noise and distortion) and SFDR (spurious-free dynamic range, the distance from the signal to the highest distortion spur in dB). The first numbers are for the ideal input, the second for the clipped signal. The ideal and clipped results are again identical for this test since the signal is not clipped. The dynamic range of the math program is ~240 dB and is reflected in the SINAD and SFDR results.

With 1% clipping, the signal flat-topping is barely visible but we see numerous spurs extending to past 10 kHz, and now SINAD is only 51 dB and SFDR around 58 dB. While significant, this is probably inaudible, especially in the presence of more complicated musical (or movie) signals. Notice the clipped sine wave does not look like a square wave, and of course the spectrum does not show the same progression in harmonic levels a square would provide. As far as power, 50 dB is a factor of 100,000 lower in power than the fundamental. If you were putting out 100 W, the total power in the clipped signal is 1 mW (0.001 W). You might hear the clipping as a very quiet harsh buzzing sound if you were to play this as a test tone. However, it is unlikely to cause any sort of speaker damage (IMO).

I performed a couple of other interesting calculations on the clipped waveform. First, the RMS voltage is now 0.713 Vrms, a 1 % increase. Second, I split the audio into three bands to see how much energy is in each band. I used ideal (perfect brick wall) crossovers of 300 Hz and 3 kHz so there is no energy shared among drivers. No, the real world does not work this way, but it was easy to do the math. Adding more realistic filters is possible but a bit painful the way I am doing things (would require a significant amount of programming effort). Note 1 % is -40 dB relative to the maximum signal but the energy in any given band will be less (all the clipping energy combined would yield a -40 dB SINAD). For this test, the low frequency (woofer) SINAD is 58 dB, midrange is 52 dB, and high range (tweeter) is 71 dB. That means the tweeter is actually receiving about 20 dB less of the clipped signal than the woofer or midrange, which are roughly equal. This is expected given the low test frequency.
Next I increased the clipping level to 10 %. The flat top is now clearly visible, and notice the more clearly defined frequency roll-off as we get closer to a square wave. Notice that 10 % clipping reduces SINAD to 27.5 dB and SFDR to 29.7 dB, still fairly small relative to the signal (only 1/1000 the power) but high enough that I suspect many of us can hear it even with the music playing. More complicated signals will produce more complex distortion but the idea is the same; added high-frequency content and higher power than in the original signals. In this case, the signal voltage is now 0.757 Vrms, a 7 % increase over the pure sine wave. The woofer and midrange both have about 30 dB SINAD, and the tweeter about 60 dB. That is, the woofer and midrange are both getting an extra 0.1 W from our (clipped) 100 W output, and the tweeter is getting about 100 uW (0.0001 W). Still seems unlikely to cause damage, at least for this low-frequency signal.

Just for grins I ran a test with 50 % clipping (!) This seems like a lot, but remember if you really are at your amplifier’s clipping point, then an extra 3 dB peak will induce 50 % clipping since it is a request for twice the power. The signal is now pretty close to a square wave; note the third harmonic of a square wave is about -9.54 dB below the fundamental frequency. The woofer range SINAD is 11.2 dB (~8 W of our 100 W) and only the third harmonic lies in that band. The midrange SINAD is up to 23.5 dB (~0.5 W), and the tweeter 48.3 dB (1.5 mW). Notice the frequencies are odd harmonics and more closely follow the expected (square wave’ish) reduction in amplitude.

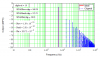
Now let’s look at some plots using higher-frequency signals for our test. Below is shown a 1 kHz signal with 1 % clipping. Only the spectrum is shown; the waveform looks like the previous waveform except for the time scale. Now there is no energy in the woofer (as expected), the midrange SINAD is about 58.5 dB, and the tweeter’s SINAD is 52.5 dB. Again relative to 100 W, that puts about 142 uW (0.000142 W) into the midrange and 559 uW (0.000559 W) into the tweeter. What is interesting is not the magnitudes, which are still in the mud, but that the tweeter is actually getting more energy from distortion than the midrange driver. However, remember that the midrange’s signal level is still 100 W, far above the distortion levels.

The test is repeated below for 10 % and 50 % distortion. The results are similar to before, with shifts in frequencies. Now woofer power is 0, the signal is 100 W in the midrange driver, and distortion products generate 0.124 W in the midrange and 0.0203 W in the tweeter with 10 % clipping of the 1 kHz sine wave. Clipped 50 %, we see 7.6 W in the midrange and 0.15 W in the tweeter from distortion.


Another set of trials was performed using a 6 kHz input signal. Only the 10 % spectrum is shown – note all distortion products now go to the tweeter, which is again driven with 100 W (pretty unrealistic, but we are looking at relative levels here). With 1 % clipping, there is an additional 0.0008 W tweeter power. There are 0.203 W added at 10 %, and 8.05 W added with 50 % clipping. If tweeter power was 10 W, less than 1 W additional power from 50 % clipping is added.

Applying multiple signals is a bit tricky. If each signal (100 Hz, 1 kHz, 6 kHz) were of equal amplitude, then the higher-frequency signals riding on the low-frequency tone will clip much more and the frequency spectrum of the resultant clipped wave will be weighted to the upper frequencies. This can be seen in the figure below, comprised of three tones (100, 1000, and 6000 Hz) of equal amplitude summed and adjusted so that the peaks are clipped by 10 %. The spectrum has little low-frequency content, then a large “hump” caused by mid- and high-frequency clipping. There are spurs throughout the frequency range, not just above 100 Hz, due to nonlinear mixing products from clipping the three signals. Still, very little power reaches the tweeter.

Increasing the clipping to 50 % yields the spectrum and data below. Now there is a great deal of additional power in the midrange (5.4 W) and even more in the tweeter (31.5 W). This is the sort of signal and clipping that can destroy a tweeter, again assuming a 100 W signal into the speaker system. This sort of distortion will be clearly audible, of course, though in the real world is probably very brief. Barring loud parties and alcohol…

Weighting the 100 Hz, 1 kHz, and 6 kHz signals in the ratio 100:10:1 and clipping the result by 10 % yields the waveform and frequency response below. This is closer to what a “real” signal might look like, with higher-amplitude lows and lower highs. Note clipping products (distortion spurs) are only about 20 dB below the middle tone, and many are at roughly the same amplitude as the high-frequency tone. Still not enough power to damage the tweeter, but enough to make for objectionable listening.

Repeat, this time with 50 % clipping. Now distortion spurs exceed the midrange and tweeter signals as the low signal is grossly clipped. Note that extra power from clipping in the midrange and tweeter bands is still low, however, at 1.03 W and 0.0143 W respectively relative to a 100 W signal. The harmonics and mixing products from clipping fall off quickly so, unless the midrange and tweeter signals are fairly large, not enough power to cause damage is likely to be generated. Some music may have middle and high frequencies higher than this example, however, so caution is in order.

Clearly clipping does add power at higher frequencies, but in practice it would have to be severe clipping to add enough power to cause speaker damage. More likely is that with the volume turned so high the net power into the drivers is simply too large for them to handle, clipped signal or not, since the distortion should be clearly audible. This does not rule out damage from overzealous listening, parties, and so forth.
There are a couple of other things that can cause damage, however:
Amplifier clipping has been cited as the cause of audible distortion, destruction of speakers (especially tweeters), and total annihilation of the known universe. More or less. In fact, clipping does cause distortion that adds significant high-frequency content not in the original signal, and does present higher power to the speaker. But perhaps less that you might expect, at least in some cases…
To address power first, a pure sine wave (undistorted signal) with peak amplitude A has an RMS value of A/sqrt(2) or 0.7071*A. A heavily clipped sine wave approximates a square wave, and thus has RMS value of A, about 30% higher. Assuming voltage is clipped, the square wave has twice the power of the pure sine wave since power is related to voltage squared. That is, a heavily clipped signal puts up to twice the power into the speaker as an unclipped signal of the same (peak) amplitude. Less-clipped signals will not have as large a power increase, naturally.
We already know square waves can be made from a series of sine waves (see related thread), thus clipping must add higher frequency content to create those sharply flattened peaks. An ideal square wave adds odd harmonics in proportion to their harmonic number, e.g. the third harmonic is at 1/3 the voltage of the fundamental, the fifth is at 1/5 the voltage, and so on. Remember power goes as voltage squared, so in terms of power the third harmonic is 1/9 the power of the fundamental, the fifth harmonic is at 1/25, etc. Power dies out pretty rapidly and is one of the common counter arguments to clipping “blowing up” speakers.
The figure below shows a pure 100 Hz sine wave. The signal is sampled at 4 MS/s but is not otherwise quantized (i.e. no explicit DAC; the math program’s resolution is about 38 bits for this example). The signal is 2 Vpp, or about 0.707 Vrms. Note cliplevel = 0 % means no clipping and so the ideal and “clipped” signals are identical in the top plot. The spectral diagram (FFT) shows the resulting frequency content up to 1 MHz, and includes the calculated SINAD (signal to noise and distortion) and SFDR (spurious-free dynamic range, the distance from the signal to the highest distortion spur in dB). The first numbers are for the ideal input, the second for the clipped signal. The ideal and clipped results are again identical for this test since the signal is not clipped. The dynamic range of the math program is ~240 dB and is reflected in the SINAD and SFDR results.
With 1% clipping, the signal flat-topping is barely visible but we see numerous spurs extending to past 10 kHz, and now SINAD is only 51 dB and SFDR around 58 dB. While significant, this is probably inaudible, especially in the presence of more complicated musical (or movie) signals. Notice the clipped sine wave does not look like a square wave, and of course the spectrum does not show the same progression in harmonic levels a square would provide. As far as power, 50 dB is a factor of 100,000 lower in power than the fundamental. If you were putting out 100 W, the total power in the clipped signal is 1 mW (0.001 W). You might hear the clipping as a very quiet harsh buzzing sound if you were to play this as a test tone. However, it is unlikely to cause any sort of speaker damage (IMO).
I performed a couple of other interesting calculations on the clipped waveform. First, the RMS voltage is now 0.713 Vrms, a 1 % increase. Second, I split the audio into three bands to see how much energy is in each band. I used ideal (perfect brick wall) crossovers of 300 Hz and 3 kHz so there is no energy shared among drivers. No, the real world does not work this way, but it was easy to do the math. Adding more realistic filters is possible but a bit painful the way I am doing things (would require a significant amount of programming effort). Note 1 % is -40 dB relative to the maximum signal but the energy in any given band will be less (all the clipping energy combined would yield a -40 dB SINAD). For this test, the low frequency (woofer) SINAD is 58 dB, midrange is 52 dB, and high range (tweeter) is 71 dB. That means the tweeter is actually receiving about 20 dB less of the clipped signal than the woofer or midrange, which are roughly equal. This is expected given the low test frequency.
Next I increased the clipping level to 10 %. The flat top is now clearly visible, and notice the more clearly defined frequency roll-off as we get closer to a square wave. Notice that 10 % clipping reduces SINAD to 27.5 dB and SFDR to 29.7 dB, still fairly small relative to the signal (only 1/1000 the power) but high enough that I suspect many of us can hear it even with the music playing. More complicated signals will produce more complex distortion but the idea is the same; added high-frequency content and higher power than in the original signals. In this case, the signal voltage is now 0.757 Vrms, a 7 % increase over the pure sine wave. The woofer and midrange both have about 30 dB SINAD, and the tweeter about 60 dB. That is, the woofer and midrange are both getting an extra 0.1 W from our (clipped) 100 W output, and the tweeter is getting about 100 uW (0.0001 W). Still seems unlikely to cause damage, at least for this low-frequency signal.
Just for grins I ran a test with 50 % clipping (!) This seems like a lot, but remember if you really are at your amplifier’s clipping point, then an extra 3 dB peak will induce 50 % clipping since it is a request for twice the power. The signal is now pretty close to a square wave; note the third harmonic of a square wave is about -9.54 dB below the fundamental frequency. The woofer range SINAD is 11.2 dB (~8 W of our 100 W) and only the third harmonic lies in that band. The midrange SINAD is up to 23.5 dB (~0.5 W), and the tweeter 48.3 dB (1.5 mW). Notice the frequencies are odd harmonics and more closely follow the expected (square wave’ish) reduction in amplitude.
Now let’s look at some plots using higher-frequency signals for our test. Below is shown a 1 kHz signal with 1 % clipping. Only the spectrum is shown; the waveform looks like the previous waveform except for the time scale. Now there is no energy in the woofer (as expected), the midrange SINAD is about 58.5 dB, and the tweeter’s SINAD is 52.5 dB. Again relative to 100 W, that puts about 142 uW (0.000142 W) into the midrange and 559 uW (0.000559 W) into the tweeter. What is interesting is not the magnitudes, which are still in the mud, but that the tweeter is actually getting more energy from distortion than the midrange driver. However, remember that the midrange’s signal level is still 100 W, far above the distortion levels.
The test is repeated below for 10 % and 50 % distortion. The results are similar to before, with shifts in frequencies. Now woofer power is 0, the signal is 100 W in the midrange driver, and distortion products generate 0.124 W in the midrange and 0.0203 W in the tweeter with 10 % clipping of the 1 kHz sine wave. Clipped 50 %, we see 7.6 W in the midrange and 0.15 W in the tweeter from distortion.
Another set of trials was performed using a 6 kHz input signal. Only the 10 % spectrum is shown – note all distortion products now go to the tweeter, which is again driven with 100 W (pretty unrealistic, but we are looking at relative levels here). With 1 % clipping, there is an additional 0.0008 W tweeter power. There are 0.203 W added at 10 %, and 8.05 W added with 50 % clipping. If tweeter power was 10 W, less than 1 W additional power from 50 % clipping is added.
Applying multiple signals is a bit tricky. If each signal (100 Hz, 1 kHz, 6 kHz) were of equal amplitude, then the higher-frequency signals riding on the low-frequency tone will clip much more and the frequency spectrum of the resultant clipped wave will be weighted to the upper frequencies. This can be seen in the figure below, comprised of three tones (100, 1000, and 6000 Hz) of equal amplitude summed and adjusted so that the peaks are clipped by 10 %. The spectrum has little low-frequency content, then a large “hump” caused by mid- and high-frequency clipping. There are spurs throughout the frequency range, not just above 100 Hz, due to nonlinear mixing products from clipping the three signals. Still, very little power reaches the tweeter.
Increasing the clipping to 50 % yields the spectrum and data below. Now there is a great deal of additional power in the midrange (5.4 W) and even more in the tweeter (31.5 W). This is the sort of signal and clipping that can destroy a tweeter, again assuming a 100 W signal into the speaker system. This sort of distortion will be clearly audible, of course, though in the real world is probably very brief. Barring loud parties and alcohol…
Weighting the 100 Hz, 1 kHz, and 6 kHz signals in the ratio 100:10:1 and clipping the result by 10 % yields the waveform and frequency response below. This is closer to what a “real” signal might look like, with higher-amplitude lows and lower highs. Note clipping products (distortion spurs) are only about 20 dB below the middle tone, and many are at roughly the same amplitude as the high-frequency tone. Still not enough power to damage the tweeter, but enough to make for objectionable listening.
Repeat, this time with 50 % clipping. Now distortion spurs exceed the midrange and tweeter signals as the low signal is grossly clipped. Note that extra power from clipping in the midrange and tweeter bands is still low, however, at 1.03 W and 0.0143 W respectively relative to a 100 W signal. The harmonics and mixing products from clipping fall off quickly so, unless the midrange and tweeter signals are fairly large, not enough power to cause damage is likely to be generated. Some music may have middle and high frequencies higher than this example, however, so caution is in order.
Clearly clipping does add power at higher frequencies, but in practice it would have to be severe clipping to add enough power to cause speaker damage. More likely is that with the volume turned so high the net power into the drivers is simply too large for them to handle, clipped signal or not, since the distortion should be clearly audible. This does not rule out damage from overzealous listening, parties, and so forth.
There are a couple of other things that can cause damage, however:
- Amplifiers often clip asymmetrically, that has more on the top or bottom. That will introduce an effective offset that looks like a D.C. signal component that can go through the woofer, potentially causing damage.
- As Amir’s testing as reported in other threads has shown, some amplifiers are not stable when they clip. This can cause high-frequency ringing and even oscillation, adding to the clipping distortion and again potentially damaging drivers.
Attachments
Last edited:
 I think I agree with what think you (DonH56) are saying and I'll add a few comments...