
-
WANTED: Happy members who like to discuss audio and other topics related to our interest. Desire to learn and share knowledge of science required. There are many reviews of audio hardware and expert members to help answer your questions. Click here to have your audio equipment measured for free!
You are using an out of date browser. It may not display this or other websites correctly.
You should upgrade or use an alternative browser.
You should upgrade or use an alternative browser.
Exploration of data provided by vendors
- Thread starter pierre
- Start date
- Joined
- Jan 15, 2020
- Messages
- 6,909
- Likes
- 16,984
When there are no prices online I get usually suspicious that they are so high that the good idea ofno, I did Google it quickly too and didn't find an obvious answer.
might be not a realistic option, let's see though, maybe someone knows it...Excellent little speaker. You can put one on each side of your screen and be happy. SPL will not be an issue.
@pierre thank you very much! I feel a bit sorry that I requested a speaker which don't fit perfectly into your web page framework. Adjusting everything is a lot of work I guess. Thanks again.Kling & Freitag PIA M is a column speaker. It is a passive one with 2 sections: the bass part can be set to bass reflex or cardiod mode, the high part can be set to 3 different patterns (narrow, medium, wide). So you have 6 modes to play with.
Let's start with the bassreflex wide: that's chaos or it looks like it.
View attachment 238142
DI curves are different from the classical dipole speaker. You see the impact on the Estimated in room response which is not bad at all.
View attachment 238143
The interesting parts are the radiation patterns: horizontal first normalized (pretty good)
View attachment 238148
and then horizontal:
View attachment 238149
The vertical pattern is typical of column with a very very narrow angle:
View attachment 238152
Switching to cardiod wide mode, you clearly see a nice impact on the horizontal view:
View attachment 238153
The 6 variants will be available soonish on the website with all the gory details.
I think the wide and narrow mode seems to be the other way around.
Measurements for speaker Kling Freitag PIA M
Measurements for speaker Kling Freitag PIA M
Interesting to compare the spinorama with the measurements of production and partner linked on the page of the speaker.
Alcone speakers seems to be top-notch.
OP
- Thread Starter
- #24
Hello,
I transformed another batch of GLL files. I will make some comparisons between them later on but for now, let's look at 2 good surprises from Yamaha.
Yamaha is very well known and respected in the pro audio world. They have everything you can dream of, from cheap stuff for bedrooms to over the top consoles used all over the world in studio or broadcast.
They have a fair number of passive/active speakers for live usage. They have multiple series at different price points (DBR, DXT, DZR etc each of them in 8in, 10in, 12in, 15in).
Here are 2 good ones.

Before we dive into it, keep in mind a few things. Most of this speakers optimise for high output (usually over 120dB), low frequency extension is high around 80 and that's on purpose. They are always use with a subwoofer (or multiples subs). They are also almost always use with extensive DSP and all the new ones have an integrated one.
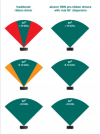
The frequency response is less important than the DI curves since you have a lot of headroom and every sane user will use EQ on those. Also most of them are optimised for some dispersion pattern. They are usually broad on the horizontal plane but on purpose restricted on the vertical ones to minimise reflection issues. They can be good prb solvers in a non treated room. Of course you will never have an issue with volume even in your very large dining room or your reconverted barn.
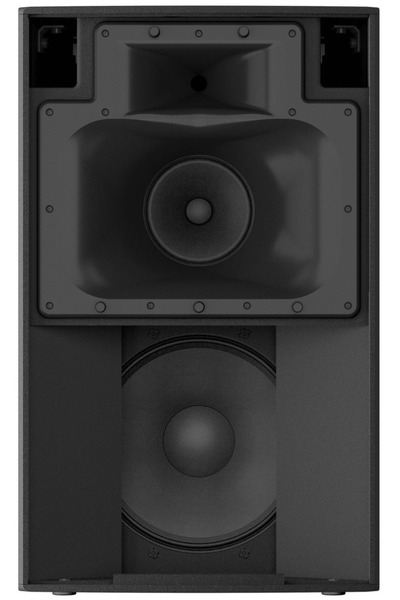
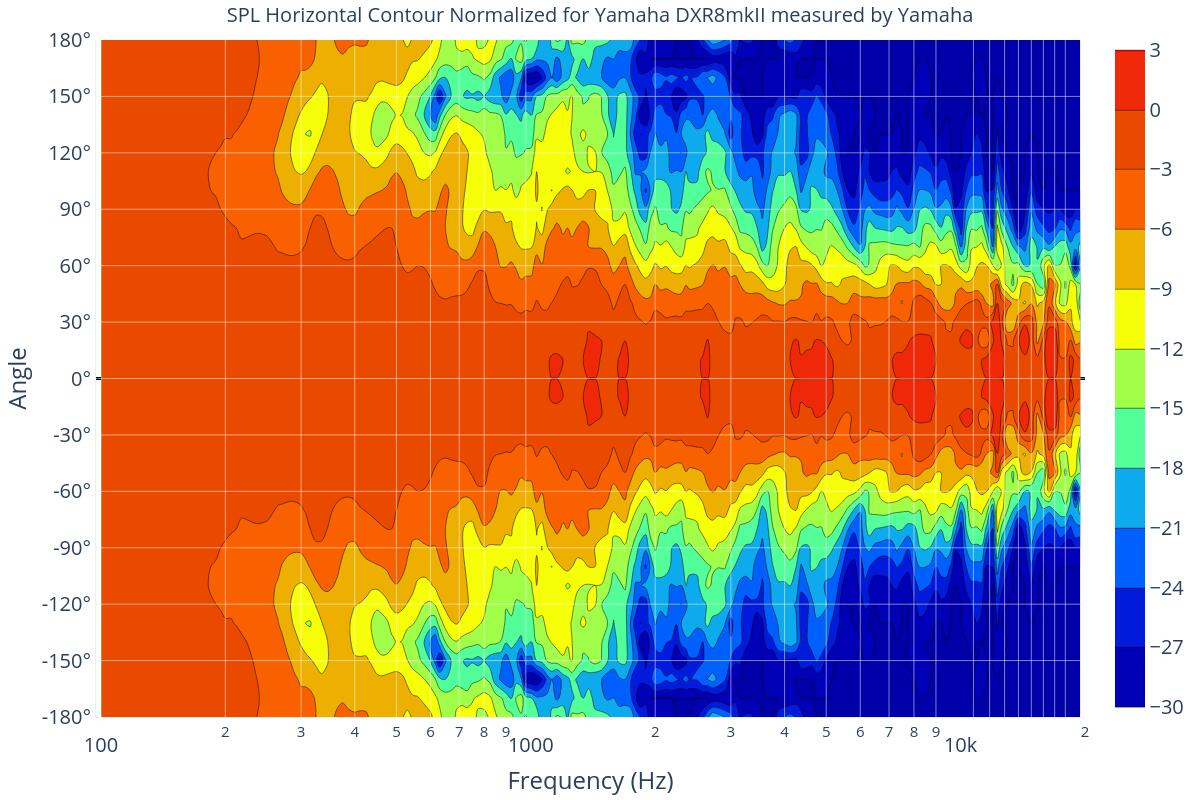
Let's start with the DXR8mkII (as it names implies a 8in + a 1in) and DSP already implemented with a sharp low pass filter. That's not too bad if you ask me, on axis and listening axis are close, DI is ok-ish even if they did not work too much on the crossover. You clearly see the 80x40 pattern for dispersion. They cost 1300$ for a pair in CH.
Yamaha claims 130dB SPL which looks super unlikely for a 8in, maybe at the best freq at 10% distorsion. You will likely still get 100dB SPL over 70Hz per speaker which is a lot and a lot more if you had subs.


Let's look know at a DZR315 a bigger brother: a 3 way with a 15in and a horn for 3400$ a pair. Max output increase by a few DB. You can buy a pair with 2x18'' subs for 6600$.
The quality of the measurement is a bit lower than the previous one but we still get a good idea.
The spinorama shows linear DI that bodes well for post EQ results. Out of the box the on axis is not great at all.

Estimated in room is reasonable


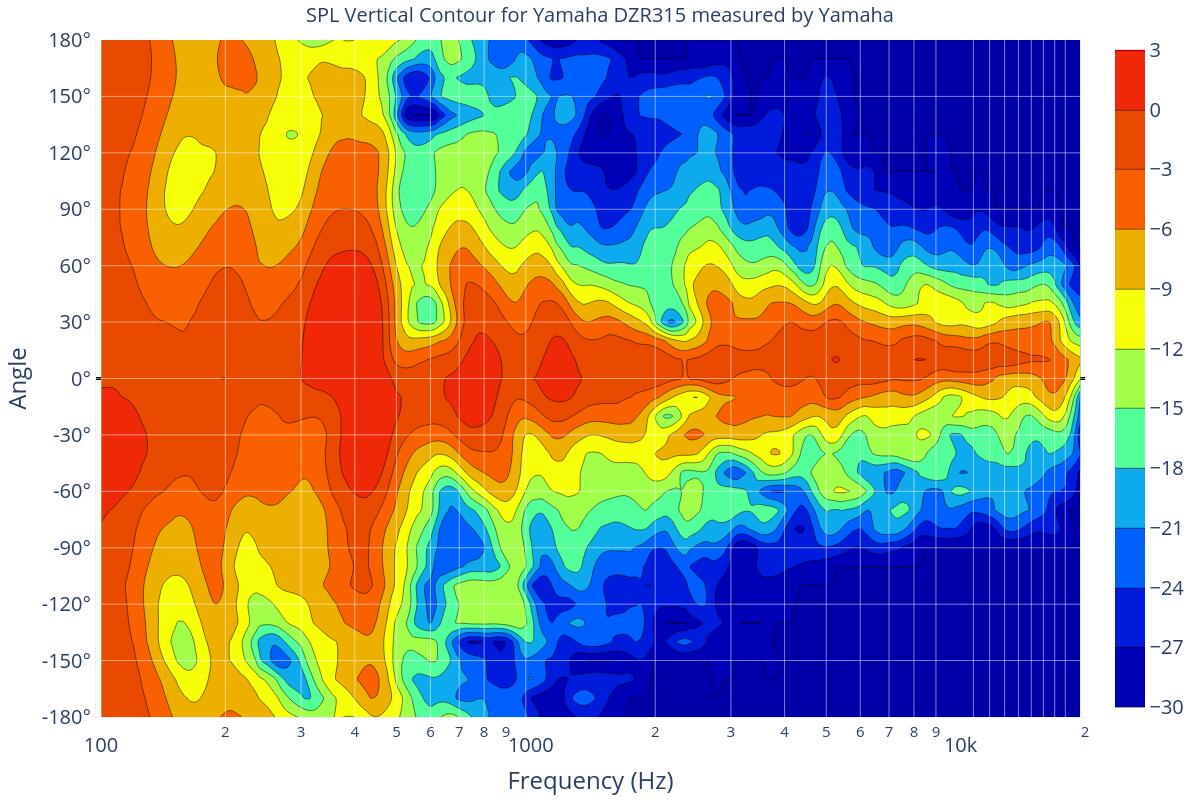
Horizontal contours show narrow dispersion and the vertical has some pinches that we usually see in 2 ways.
I did listen to this one with subs and EQed and that's a great experience. Dynamic has no limit and freq response was good enough. It was enjoyable and I am difficult.
Proof that if the look does not put you off the PA speakers did improve very significantly and that the added DSP with FIR filters are doing a good job.
More graphs and all harmarn scores are available as usual here https://www.spinorama.org/
I transformed another batch of GLL files. I will make some comparisons between them later on but for now, let's look at 2 good surprises from Yamaha.
Yamaha is very well known and respected in the pro audio world. They have everything you can dream of, from cheap stuff for bedrooms to over the top consoles used all over the world in studio or broadcast.
They have a fair number of passive/active speakers for live usage. They have multiple series at different price points (DBR, DXT, DZR etc each of them in 8in, 10in, 12in, 15in).
Here are 2 good ones.
Before we dive into it, keep in mind a few things. Most of this speakers optimise for high output (usually over 120dB), low frequency extension is high around 80 and that's on purpose. They are always use with a subwoofer (or multiples subs). They are also almost always use with extensive DSP and all the new ones have an integrated one.
The frequency response is less important than the DI curves since you have a lot of headroom and every sane user will use EQ on those. Also most of them are optimised for some dispersion pattern. They are usually broad on the horizontal plane but on purpose restricted on the vertical ones to minimise reflection issues. They can be good prb solvers in a non treated room. Of course you will never have an issue with volume even in your very large dining room or your reconverted barn.
Let's start with the DXR8mkII (as it names implies a 8in + a 1in) and DSP already implemented with a sharp low pass filter. That's not too bad if you ask me, on axis and listening axis are close, DI is ok-ish even if they did not work too much on the crossover. You clearly see the 80x40 pattern for dispersion. They cost 1300$ for a pair in CH.
Yamaha claims 130dB SPL which looks super unlikely for a 8in, maybe at the best freq at 10% distorsion. You will likely still get 100dB SPL over 70Hz per speaker which is a lot and a lot more if you had subs.
Let's look know at a DZR315 a bigger brother: a 3 way with a 15in and a horn for 3400$ a pair. Max output increase by a few DB. You can buy a pair with 2x18'' subs for 6600$.
The quality of the measurement is a bit lower than the previous one but we still get a good idea.
The spinorama shows linear DI that bodes well for post EQ results. Out of the box the on axis is not great at all.
Estimated in room is reasonable
Horizontal contours show narrow dispersion and the vertical has some pinches that we usually see in 2 ways.
I did listen to this one with subs and EQed and that's a great experience. Dynamic has no limit and freq response was good enough. It was enjoyable and I am difficult.
Proof that if the look does not put you off the PA speakers did improve very significantly and that the added DSP with FIR filters are doing a good job.
More graphs and all harmarn scores are available as usual here https://www.spinorama.org/
Last edited:
Curvature
Major Contributor
- Joined
- May 20, 2022
- Messages
- 1,125
- Likes
- 1,421
@pierre, can you please try to extract the data in the Polar Map software by Geddes? It contains detailed measurements of certain speakers (mostly his designs). http://www.gedlee.com/Application Files/RunPolarMap.aspx
OP
- Thread Starter
- #26
I had a look. I would have a better chance asking him to share the data.@pierre, can you please try to extract the data in the Polar Map software by Geddes? It contains detailed measurements of certain speakers (mostly his designs). http://www.gedlee.com/Application Files/RunPolarMap.aspx
Curvature
Major Contributor
- Joined
- May 20, 2022
- Messages
- 1,125
- Likes
- 1,421
Professional Loudspeakers & Sound Systems | Martin Audio
Professional Loudspeakers & Sound Systems. Martin Audio Offers a Full Complement of Professional Audio Speakers for all Live Sound Systems and Commercial Audio Installations.
 martin-audio.com
Not everything includes measurements, although this interesting coaxial model has EASE data: https://martin-audio.com/products/loudspeakers/cdd-live15
OP
- Thread Starter
- #31
@pierre, what's the name of the software you use to generate these graphs? I don't think it's possible to overlay DI, ... on FR graph with GLL Viewer (afmg).
i use PowerAutomate on windows to generate the 36 horizontal and 36 vertical measurements. Then from there I use the same software I built to manipulate and generate spinorama. The software is open source so you can have a look at how it works https://github.com/pierreaubert/spinorama.
Gll viewer has an export function but only for one graph. It is tedious to do the 72 measurements manually and Power Automate or similar tools are designed exactly for that, automate the boring part. The software is replaying what you would do by hand, just faster and of course without you moving the mouse.
miha
Member
- Joined
- Mar 30, 2022
- Messages
- 11
- Likes
- 7
Nice, I'll have a look! Thanks!i use PowerAutomate on windows to generate the 36 horizontal and 36 vertical measurements. Then from there I use the same software I built to manipulate and generate spinorama. The software is open source so you can have a look at how it works https://github.com/pierreaubert/spinorama.
Gll viewer has an export function but only for one graph. It is tedious to do the 72 measurements manually and Power Automate or similar tools are designed exactly for that, automate the boring part. The software is replaying what you would do by hand, just faster and of course without you moving the mouse.
Hello All,Do you know their price range as quick googling didn't show me any prices?
I brought Alcons Audio to CEDIA 2015 and 2016, have many of their systems installed and was successful in getting the director of Dolby Atmos Cinema Products to include the data for the 4" Ribbon speakers ( the crown jewel in the point source line) in the Dolby Cinema Designer Program in 2016, by 2019 The Monopoly that Meyer had in the DOLBY ATMOS PREMIER DUBSTAGE certified studio programs came to an end after 8 Meyers Acheron Premiere studios Alcons dethroned them. I am not allowed to mention what I heard privately from the person responsible for the commissioning, but backflips might have taken place. I also wrote an article on my history with Alcons why i ended up only endorsing the CRMS line.
I am a relative newbie to the field of measurements as I (a sworn enemy of 2 ch. stereo
") ) am concerned solely with multichannel sound and conducting listening tests with single speakers in mono to me sounded woefully counterintuitive for decades but, as I understand the science better after enjoying the benefits of the 5x dynamic ratio, Alcons Controlled Directivity(90 degree 1-20) with minimum decay times on an 11.8.10 system, I am enjoying the knowledge digging part, so please bear with me, English is my second language and my spirits get enthusiastically elevated easily ( a Cuban thing ). I occasionally take an overkill approach to new areas of knowledge, for example I am beginning to associate with the top mathematicians in finite and boundary element predictive work to empirically take every piece of furniture in the room to the surface and core level into consideration for mathematical calculations to extreme intents and purposes for great correlation results with real measurements - like custom modelled acoustical devices micro targeted to a small RLP.
) am concerned solely with multichannel sound and conducting listening tests with single speakers in mono to me sounded woefully counterintuitive for decades but, as I understand the science better after enjoying the benefits of the 5x dynamic ratio, Alcons Controlled Directivity(90 degree 1-20) with minimum decay times on an 11.8.10 system, I am enjoying the knowledge digging part, so please bear with me, English is my second language and my spirits get enthusiastically elevated easily ( a Cuban thing ). I occasionally take an overkill approach to new areas of knowledge, for example I am beginning to associate with the top mathematicians in finite and boundary element predictive work to empirically take every piece of furniture in the room to the surface and core level into consideration for mathematical calculations to extreme intents and purposes for great correlation results with real measurements - like custom modelled acoustical devices micro targeted to a small RLP.Alcons Waterfall Plots use the least amount of smoothing than any other waveguided speaker I believe. While the price lists are confidential anyone curios can PM. You cannot buy the speaker without a sentinel 4 channel amp, so yes VERY VERY expensive, but once you hear it somehow you forget the amp concern and are awed by the overall system value. I wish we could get a GLL file for their CRMS SR HV model, the greatest Atmos point source systems could be built around that speaker and multichannel cardioid subs.
WHY SUCH PHYSICALITY OF THE PHANTOM IMAGES?
Last edited:
Homonyme quelle ressource brillante, mes compliments!
I had been wondering if it would be possible to extract spinoramas from GLL files, you gave me the answer I was looking for.
The Alcons QR-24 could be a Wisdom Contender in line array (due to controlled directivity and dynamics), although it is considered too much for Home Theater.

Pierre, since you mentioned Line Arrays would be next on your agenda, feel free to produce spinoramas for this setup (the GLL files you know where to get):

Alas those stacks are not tall enough to behave in cylindrical fashion in the Fresnel region down to 40 hz you will need more cow bell.
But wait! Please stay on the point sources for the Musikelectronik Geithain ME 804K:


This is what The Factory Measured.


As I mentioned in this post there is a 50% chance I might get a pair to Amir, but absent that there is a somewhat controversial measurement report in the attached below PDF that yields that the speakers are best positioned 15 degree of axis, can you please overlay these findings to compare plots? Merci. Amir could be the final arbiter but FROM A PHYSICAL SPEAKER FOOTPRINT (occupied space area) ERGONOMICS, in order to site the many freestanding speakers of the bed channel with a shallower profile front of acoustic cubicle speaker fabric to the back wall. To me ARCHITECTURALLY that is a dream come true for the next generation of SUPERSPEAKERS needed as the Tecktonik plates of Bass Management start shifting this January from SIMO TO MIMO.

Exploiting this 15 degree so called "bug" could allow the setting back 3" of acoustical cubicle fabric outward on each side adding 6" of usable walking space in a theater with these speakers ( albeit a modular variant).
That is the upside, can you point to the downsides and what the degree of negativity this brings vs the great many positives? I am in your expert hands, here to learn...
I had been wondering if it would be possible to extract spinoramas from GLL files, you gave me the answer I was looking for.
The Alcons QR-24 could be a Wisdom Contender in line array (due to controlled directivity and dynamics), although it is considered too much for Home Theater.
Pierre, since you mentioned Line Arrays would be next on your agenda, feel free to produce spinoramas for this setup (the GLL files you know where to get
):Alas those stacks are not tall enough to behave in cylindrical fashion in the Fresnel region down to 40 hz you will need more cow bell.
But wait! Please stay on the point sources for the Musikelectronik Geithain ME 804K:
musikelectronic geithain gmbh - ME 804K
www.me-geithain.de
This is what The Factory Measured.
As I mentioned in this post there is a 50% chance I might get a pair to Amir, but absent that there is a somewhat controversial measurement report in the attached below PDF that yields that the speakers are best positioned 15 degree of axis, can you please overlay these findings to compare plots? Merci. Amir could be the final arbiter but FROM A PHYSICAL SPEAKER FOOTPRINT (occupied space area) ERGONOMICS, in order to site the many freestanding speakers of the bed channel with a shallower profile front of acoustic cubicle speaker fabric to the back wall. To me ARCHITECTURALLY that is a dream come true for the next generation of SUPERSPEAKERS needed as the Tecktonik plates of Bass Management start shifting this January from SIMO TO MIMO.
Exploiting this 15 degree so called "bug" could allow the setting back 3" of acoustical cubicle fabric outward on each side adding 6" of usable walking space in a theater with these speakers ( albeit a modular variant).
That is the upside, can you point to the downsides and what the degree of negativity this brings vs the great many positives? I am in your expert hands, here to learn...
Attachments
Last edited:
I shared these results with the owner at Alcons, apparently you have been using the default settings.Do you know their price range as quick googling didn't show me any prices?
"
Yes, not too bad.
However, they use the GLL data with the default settings: Info at 100m with air-absorption “on” and then the QRP20 has all of a sudden 6dB less top high.
Other than that, “not too bad”. J
What happens if you turn the air-absorption settings to OFF and set it at 6 meters instead Pierre?
kyle_neuron
Active Member
- Joined
- Jun 18, 2021
- Messages
- 149
- Likes
- 254
Hi @pierre,i use PowerAutomate on windows to generate the 36 horizontal and 36 vertical measurements. Then from there I use the same software I built to manipulate and generate spinorama. The software is open source so you can have a look at how it works https://github.com/pierreaubert/spinorama.
Gll viewer has an export function but only for one graph. It is tedious to do the 72 measurements manually and Power Automate or similar tools are designed exactly for that, automate the boring part. The software is replaying what you would do by hand, just faster and of course without you moving the mouse.
I came across your website today & begun digging in your GitHub repository to determine if you were indeed manually extracting (or tracing) GLL data before finding this thread.
Firstly - excellent work; the more this data is available the better.
I have however noticed a couple of errors in some of the plots, which seem to also create incorrect values in the Data tab for the affected loudspeakers.
In addition to disabling air absorption as the folks at Alcons suggest, I’d also recommend using the “High (2.5 degree)” resolution setting, the “AES2 Broadband” stimulus type, and a receiver distance that’s more representative of the typical use for PA speakers.
10 metres would be my suggestion for that, as it would be super easy to convert back to an equivalent 1-metre sensitivity metric; especially if you’re already doing that from 100-metre simulations. Many of these speakers are flown in a venue or used at a concert where the metal pit barrier is 3-5 metres from the cabinet grille, so 6 metres is a little close in my opinion.
I also note you looked at the predicted maximum SPL for the Yamaha powered speakers. It doesn't explicitly state the distortion metric used as a stop condition, but the GLL data should allow you to see the measured maximum SPL in a similar manner to Anselm at Production Partner if you use the IEC-filtered stimulus type when generating the balloon.
Quite a lot of GLL files are unfortunately heavily smoothed, have 'fudged' sensitivity values to appear louder in EASE models than the competitors, or have been measured with DSP in use already.
There's no way to know without parsing the data, sadly, but it's one to watch for. You might be able to automate the detection of some of these. Some are easier to spot than others, of course; no ported point source speaker with two 10" LF drivers & a coaxial 8"/1.4" horn in the middle has a sensitivity of 134 dB...
May I also recommend stating the data has been extracted from the manufacturer's GLL data on the website if that is the case?
All that aside, the bigger bug is in regard to the vertical directivity data for several PA loudspeakers.
There are two examples in your first post on this thread; the Meyer ULTRA-X20 and MINA. These are both cabinets which are symmetrical in both planes, but your plots show a significant negative offset in the vertical data.
For example:
A collection of loudspeakers measurements
 pierreaubert.github.io
At first, I thought there is a chance that your automated script is also using the default GLL balloon generation settings for this cabinet - which as a line array is often modelled as a cluster of several boxes - but that doesn't explain the similar error on symmetrical solo cabinets like several of the Danley loudspeakers.
That leaves the swapping between Meridian and Parallel angles as the most likely candidate, in my opinion. I've run afoul of this myself in the past when trying to pull data out of GLL Viewer via GUI automation, so it's easily done.
Unfortunately, I couldn't find a copy of your PowerAutomate script in the repository to try it out myself.
A good reference is the CLIO documentation for measuring 3D balloon data, and the manual for AFMG SpeakerLab Pro which covers the appropriate formatting of measured IR data to allow for easy XHN/GLL conversion.
From the rest of your repositories, I don't think you'd have any problem with correcting this, but I'm more than happy to help out if you'd like to drop me a PM here.
These issues are perhaps easier to spot if you’re used to working with these sorts of products and EASE/GLL files day-to-day
Last edited:
OP
- Thread Starter
- #37
- air absorption: should that be the reverse? high frequency should drop more with it?Hi @pierre,
I came across your website today & begun digging in your GitHub repository to determine if you were indeed manually extracting (or tracing) GLL data before finding this thread.
Firstly - excellent work; the more this data is available the better.
I have however noticed a couple of errors in some of the plots, which seem to also create incorrect values in the Data tab for the affected loudspeakers.
In addition to disabling air absorption as the folks at Alcons suggest, I’d also recommend using the “High (2.5 degree)” resolution setting, the “AES2 Broadband” stimulus type, and a receiver distance that’s more representative of the typical use for PA speakers.
- I can use 2.5 degres. That should only have an impact on polars, right? or does it have an impact of frequency precision?
- I already use the AES2 Broadband stimulus, I will see if that was the case on this one.
SG10 metres would be my suggestion for that, as it would be super easy to convert back to an equivalent 1-metre sensitivity metric; especially if you’re already doing that from 100-metre simulations. Many of these speakers are flown in a venue or used at a concert where the metal pit barrier is 3-5 metres from the cabinet grille, so 6 metres is a little close in my opinion.
That;s on the TODO list.I also note you looked at the predicted maximum SPL for the Yamaha powered speakers. It doesn't explicitly state the distortion metric used as a stop condition, but the GLL data should allow you to see the measured maximum SPL in a similar manner to Anselm at Production Partner if you use the IEC-filtered stimulus type when generating the balloon.
Yes, the software is trying to guess if that’s the case but that’s not foolproof.Quite a lot of GLL files are unfortunately heavily smoothed, have 'fudged' sensitivity values to appear louder in EASE models than the competitors, or have been measured with DSP in use already.
That should be the case but maybe that’s not explicit enough.There's no way to know without parsing the data, sadly, but it's one to watch for. You might be able to automate the detection of some of these. Some are easier to spot than others, of course; no ported point source speaker with two 10" LF drivers & a coaxial 8"/1.4" horn in the middle has a sensitivity of 134 dB...
May I also recommend stating the data has been extracted from the manufacturer's GLL data on the website if that is the case?
All that aside, the bigger bug is in regard to the vertical directivity data for several PA loudspeakers.
There are two examples in your first post on this thread; the Meyer ULTRA-X20 and MINA. These are both cabinets which are symmetrical in both planes, but your plots show a significant negative offset in the vertical data.
For example:
A collection of loudspeakers measurements
At first, I thought there is a chance that your automated script is also using the default GLL balloon generation settings for this cabinet - which as a line array is often modelled as a cluster of several boxes - but that doesn't explain the similar error on symmetrical solo cabinets like several of the Danley loudspeakers.
That leaves the swapping between Meridian and Parallel angles as the most likely candidate, in my opinion. I've run afoul of this myself in the past when trying to pull data out of GLL Viewer via GUI automation, so it's easily done.
Since it was the first batch of GLL that’s possible. I will investigate.
PowerAutomate saves a set of files in OneDrive. Is that what you want? I can share that with you, PM me.Unfortunately, I couldn't find a copy of your PowerAutomate script in the repository to try it out myself.
Yes. Thanks for the feedback. I am on vacation for 2 weeks but when I come back I will have a look.A good reference is the CLIO documentation for measuring 3D balloon data, and the manual for AFMG SpeakerLab Pro which covers the appropriate formatting of measured IR data to allow for easy XHN/GLL conversion.
From the rest of your repositories, I don't think you'd have any problem with correcting this, but I'm more than happy to help out if you'd like to drop me a PM here.
These issues are perhaps easier to spot if you’re used to working with these sorts of products and EASE/GLL files day-to-day
kyle_neuron
Active Member
- Joined
- Jun 18, 2021
- Messages
- 149
- Likes
- 254
Merry Christmas! By all means, please enjoy your time off; I'm away myselfYes. Thanks for the feedback. I am on vacation for 2 weeks but when I come back I will have a look.
but since I can be forgetful I wanted to brain-dump while the thoughts are still fresh from rummaging in your scripts.The air absorption setting applies a low pass filter based on the simulated receiver distance and some preconfigured values for temperature & humidity, as defined in ISO 9316-1. It can be useful when making predictions and models of loudspeaker systems in large venues, but not so much when making plots for the purposes of comparison to other loudspeakers.- air absorption: should that be the reverse? high frequency should drop more with it?
Those other speakers' data sets are unlikely to show air absorption effects in a significant manner due to (ideally) being measured in a temperature-controlled room or anechoic chamber. They're also likely to be measured at a distance which is in the acoustic far field, yet still much closer than where the high-frequency roll-off is more than a fraction of a decibel.
It may well be compensated for as part of the measurement process as well. That depends on who gathered the data & how fastidious they are about applying corrections for errors using things like the traversal & modal response data for the chamber.
Anyway, it's best to leave the air absorption setting off when running the GLL.
You could always add air absorption as a toggle in your script for a given listener distance and set of environmental conditions if you'd like it to be useful for comparisons.
It does only affect the resolution of the off-axis positions, but that can be super important - for some types of source more than others.- I can use 2.5 degres. That should only have an impact on polars, right? or does it have an impact of frequency precision?
While I've not analysed a lot of the GLL file outputs to explicitly to see just how much deviation there is between angular resolution settings, significant response error occurs if you don't have sufficient angular sampling points when gathering the directivity balloon measurements. That not only masks aberrations in the off-axis frequency response, but affects the highest frequency for which the data can be considered to be valid.
The criteria is that the relative phase difference between any two adjacent measurement points must be less than 90 degrees for all frequencies of interest.
It's even more crucial when dealing with theoretically planar sources such as line arrays, ribbons, and large horns.
There's a lot more info about this and various other relevant parameters for complex balloon data available in these two sources, although I'm sure you're familiar with them:
- Feistel, S. and Ahnert, W. The Significance of Phase Data for the Acoustic Prediction of Combinations of Sound Sources. 119th Convention of the AES. Convention Paper 6632, 2005.
- Feistel S., Thompson A., and Ahnert W. Methods and Limitations of Line Source Simulation. JAES. June 2009, Vol. 57, 6, pp. 379-402.
Also, all of the off-axis transfer function data is normalised to the separate on-axis sensitivity response for each individual GSS (source) within a GLL file (multi-source model).
Considering the impact on model calculation time is minimal with modern CPUs, I don't see any reason not to use the highest angular resolution setting here.
Cool. The modelled stimulus is a transform to the one used when gathering the measurement data, but that's not super important. The main difference to consider is the effect on the predicted axial sensitivity, Maximum Input Voltage frequency curve and subsequently the estimated maximum SPL value.- I already use the AES2 Broadband stimulus, I will see if that was the case on this one.
The IEC 60268-1 curve gives a more realistic value for maximum linear SPL with music playback. Although the method that AES 2012-2 defines to measure MIV does have a stop condition of a majority of each loudspeaker source's in-band frequency response deviating from the small signal curve by >2.5 dB, it is a steady-state test to find a thermal limit threshold and doesn't consider non-linearities in the acoustic response.
The process is actually kind of similar to the more recent M-Noise procedure though, so in principle the reduction in relative output level should correlate to a reduction in coherence, and therefore distortion.

As a result the MIV value is always lower than the spec sheet's maximum AES power rating, but gives a predicted maximum SPL sum level that tends to be a relatively clean output - so long as the speaker sounds good to start with!
NiceSG
That;s on the TODO list.
These things rarely are, unfortunately.Yes, the software is trying to guess if that’s the case but that’s not foolproof.
Annoyingly the blue shaded areas you see on plots in GLL Viewer's GUI which highlight the designated pass band for the loudspeaker (and by proxy, often the range of valid measurement data) aren't exported to the the tabular text data formats.
That range is fixed for all the data in the GLL though, so perhaps there's a way you can script this using the fancy AI tools that Microsoft's marketing page suggests are available in PowerAutomate? Or using WebPlotDigitizer.
I'm used to looking at GLL data but it wasn't super clear to me when compared to the data sourced from ASR and such. Considering several of the manufacturers now own a Klippel scanner, I actually got excited that this was new data from the spherical harmonic mapping process they use, at first!That should be the case but maybe that’s not explicit enough.
If you could add a note to clarify the sources for generating the plots to avoid any future confusion, that would be great.
I assumed that too, but it looks like you added a few in the last month that exhibit the same problem.Since it was the first batch of GLL that’s possible. I will investigate.
I was thinking it could be related to the various source symmetry options when the GLL file is generated; the Meyer ULTRA-X boxes have vertical symmetry, the Danley ones are mostly quarter symmetric, and so on.
That might be causing some error in the file name parsing that's occurring in the gll2hv.sh script. It seems you're exporting the data from 10-degree parallel increments around the 0, 90, 180 and 270 degree meridians, but the data at some of those meridians should be symmetrical to the opposite angle on cabinets such as the Danley J3-64.
Here's an example balloon data input configuration for a single source, taken from the SpeakerLab manual:

However it would be easier to check that if I can export & process the data using the same scripts, and compare.
Ah, I wasn't sure how the scripts were stored. I haven't used PowerAutomate myself - AutoIt has been my go to for that sort of thing on Windows for a long time, but I'd love to take a look. I'll drop you a PM with my OneDrive associated email address.PowerAutomate saves a set of files in OneDrive. Is that what you want? I can share that with you, PM me.
OP
- Thread Starter
- #39
Merry Christmas! By all means, please enjoy your time off; I'm away myself
The air absorption setting applies a low pass filter based on the simulated receiver distance and some preconfigured values for temperature & humidity, as defined in ISO 9316-1. It can be useful when making predictions and models of loudspeaker systems in large venues, but not so much when making plots for the purposes of comparison to other loudspeakers.
Those other speakers' data sets are unlikely to show air absorption effects in a significant manner due to (ideally) being measured in a temperature-controlled room or anechoic chamber. They're also likely to be measured at a distance which is in the acoustic far field, yet still much closer than where the high-frequency roll-off is more than a fraction of a decibel.
It may well be compensated for as part of the measurement process as well. That depends on who gathered the data & how fastidious they are about applying corrections for errors using things like the traversal & modal response data for the chamber.
Anyway, it's best to leave the air absorption setting off when running the GLL.
OK good rational.
You could always add air absorption as a toggle in your script for a given listener distance and set of environmental conditions if you'd like it to be useful for comparisons.
It does only affect the resolution of the off-axis positions, but that can be super important - for some types of source more than others.
While I've not analysed a lot of the GLL file outputs to explicitly to see just how much deviation there is between angular resolution settings, significant response error occurs if you don't have sufficient angular sampling points when gathering the directivity balloon measurements. That not only masks aberrations in the off-axis frequency response, but affects the highest frequency for which the data can be considered to be valid.
It doesn't cost much to generate all angles. I will check if the generated data is different aka freq response at 10 deg with precision set to 2.5, 5 or 10.
The criteria is that the relative phase difference between any two adjacent measurement points must be less than 90 degrees for all frequencies of interest.
It's even more crucial when dealing with theoretically planar sources such as line arrays, ribbons, and large horns.
Note that the spinorama has not been designed for this kind of speakers. It doesn't even take phase into consideration only frequency data.
There's a lot more info about this and various other relevant parameters for complex balloon data available in these two sources, although I'm sure you're familiar with them:
- Feistel, S. and Ahnert, W. The Significance of Phase Data for the Acoustic Prediction of Combinations of Sound Sources. 119th Convention of the AES. Convention Paper 6632, 2005.
- Feistel S., Thompson A., and Ahnert W. Methods and Limitations of Line Source Simulation. JAES. June 2009, Vol. 57, 6, pp. 379-402.
I didn't know this two and will read them. But it is clear that phase is important when combining sources since that would be the case for 2 functions of complex numbers.
Also, all of the off-axis transfer function data is normalised to the separate on-axis sensitivity response for each individual GSS (source) within a GLL file (multi-source model).
Considering the impact on model calculation time is minimal with modern CPUs, I don't see any reason not to use the highest angular resolution setting here.
Cool. The modelled stimulus is a transform to the one used when gathering the measurement data, but that's not super important. The main difference to consider is the effect on the predicted axial sensitivity, Maximum Input Voltage frequency curve and subsequently the estimated maximum SPL value.
Agreed. Estimated max SPL is important for venues but for this forum, I am not sure that's super relevant. People always want bigger and louder but they are more
in the 120 dB SPL max why PA speakers are more 130+. If I can generate a max SPL curve for a given % of distorsion that would be nice.
The IEC 60268-1 curve gives a more realistic value for maximum linear SPL with music playback. Although the method that AES 2012-2 defines to measure MIV does have a stop condition of a majority of each loudspeaker source's in-band frequency response deviating from the small signal curve by >2.5 dB, it is a steady-state test to find a thermal limit threshold and doesn't consider non-linearities in the acoustic response.
The process is actually kind of similar to the more recent M-Noise procedure though, so in principle the reduction in relative output level should correlate to a reduction in coherence, and therefore distortion.
View attachment 252318
As a result the MIV value is always lower than the spec sheet's maximum AES power rating, but gives a predicted maximum SPL sum level that tends to be a relatively clean output - so long as the speaker sounds good to start with!
Nice
These things rarely are, unfortunately.
Annoyingly the blue shaded areas you see on plots in GLL Viewer's GUI which highlight the designated pass band for the loudspeaker (and by proxy, often the range of valid measurement data) aren't exported to the the tabular text data formats.
maybe. The AI tool is pretty extensive. Possibly a simple snapshoot plus dithering would give me the 3 zones with reasonable precision. I will give it a shoot.That range is fixed for all the data in the GLL though, so perhaps there's a way you can script this using the fancy AI tools that Microsoft's marketing page suggests are available in PowerAutomate? Or using WebPlotDigitizer.
I'm used to looking at GLL data but it wasn't super clear to me when compared to the data sourced from ASR and such. Considering several of the manufacturers now own a Klippel scanner, I actually got excited that this was new data from the spherical harmonic mapping process they use, at first!
If you could add a note to clarify the sources for generating the plots to avoid any future confusion, that would be great.
the metadata file have the information.
I assumed that too, but it looks like you added a few in the last month that exhibit the same problem.
I was thinking it could be related to the various source symmetry options when the GLL file is generated; the Meyer ULTRA-X boxes have vertical symmetry, the Danley ones are mostly quarter symmetric, and so on.
That might be causing some error in the file name parsing that's occurring in the gll2hv.sh script. It seems you're exporting the data from 10-degree parallel increments around the 0, 90, 180 and 270 degree meridians, but the data at some of those meridians should be symmetrical to the opposite angle on cabinets such as the Danley J3-64.
Here's an example balloon data input configuration for a single source, taken from the SpeakerLab manual:
View attachment 252314
However it would be easier to check that if I can export & process the data using the same scripts, and compare.
Ah, I wasn't sure how the scripts were stored. I haven't used PowerAutomate myself - AutoIt has been my go to for that sort of thing on Windows for a long time, but I'd love to take a look. I'll drop you a PM with my OneDrive associated email address.
Thanks for the detailed answer. I wish there was a published API to the GLL file format.
Hi Pierre! Is there any way to calculate the preference score based on the suite of measurements used by James Larsen in his reviews at Audioholics? He has reviewed some tower speakers where the measurements look very good, such as the BMR Towers and the Def Tech Demand D15 Towers, it would be interesting to see the preference scores for those and other towers reviewed there I think.
Similar threads
- Replies
- 30
- Views
- 11K
- Replies
- 93
- Views
- 7K
- Replies
- 12
- Views
- 2K
- Replies
- 91
- Views
- 7K
- Replies
- 3
- Views
- 5K