• WANTED: Happy members who like to discuss audio and other topics related to our interest. Desire to learn and share knowledge of science required. There are many reviews of audio hardware and expert members to help answer your questions. Click here to have your audio equipment measured for free!

Help with spectrogram

ernestcarl

Major Contributor
Joined
Sep 4, 2019
Messages
3,113
Likes
2,333
Location
Canada
Not sure why you would want to record an impulse if the sweep method is just that; a method to create a room impulse (while filtering out some noise).
RT60 makes more sense for acoustical rooms (=big) which have real reverbaration, not a mix of fast reflections like our small rooms.
REW has actualy this more intresting option: https://www.roomeqwizard.com/help/help_en-GB/html/graph_rt60decay.html

personaly I prefer to look at spectogram/waterfall and make it as symetric as possible

Something your thunder comparison reminded me of. I have no idea how these two would be comparable, but it would be interesting nonetheless.

That REW page seems to be under construction as image examples do not show (in my phone browser at least).

For small rooms where modal influence is a bigger issue, T60M is probably the most useful RT trace to view — although hardly anyone looks at it right now given one has to generate it. But I’ve seen some rather unusual erratic variabilities in the results even when no EQ or level change is applied which makes me unsure of how to read it.
 

Frgirard

Major Contributor
Joined
Apr 2, 2021
Messages
1,737
Likes
1,044
Interesting... but I don't see them use a balloon in that video. Same group but with an actual balloon:


Thing is, you have to use their measurement device. I meant using whatever omni mic one already has together with the free program REW and Audacity or something else to record the impulse or balloon pop.
The balloon is an other era even I know pro still use them.
The principle is the same: a speaker emitting in all directions.
The rt is a property of a room whatever the direction the sound have the same amplitude.
 

dasdoing

Major Contributor
Joined
May 20, 2020
Messages
4,301
Likes
2,775
Location
Salvador-Bahia-Brasil
Something your thunder comparison reminded me of. I have no idea how these two would be comparable, but it would be interesting nonetheless.

oh yes, now I get it. an impulse is white-noise-ish, so yea not good to hear low end

That REW page seems to be under construction as image examples do not show (in my phone browser at least).

pics broken for me on PC, too

For small rooms where modal influence is a bigger issue, T60M is probably the most useful RT trace to view — although hardly anyone looks at it right now given one has to generate it. But I’ve seen some rather unusual erratic variabilities in the results even when no EQ or level change is applied which makes me unsure of how to read it.

yea, it still fails a lot in the low end.
two examples from 2 of the messurements I showed above.

total fail below 100

a.jpg


now this looks like it could be close to reality (?)

b.jpg
 

ernestcarl

Major Contributor
Joined
Sep 4, 2019
Messages
3,113
Likes
2,333
Location
Canada
oh yes, now I get it. an impulse is white-noise-ish, so yea not good to hear low end


pics broken for me on PC, too


yea, it still fails a lot in the low end.
two examples from 2 of the messurements I showed above.

total fail below 100

View attachment 183685


now this looks like it could be close to reality (?)

View attachment 183686

Equalization appears to have an effect on the modal behavior, perhaps even introducing ringing?

Here's my sub with just using a few simple PEQs:

1643806994969.png


1643807003760.png


Even simple low q minimum phase PEQs seem to cause increased RT (T60M) at certain areas. Altering EQ and SPL levels have an effect seen more often in the bass -- it may improve/worsen the calculated result.
 

dasdoing

Major Contributor
Joined
May 20, 2020
Messages
4,301
Likes
2,775
Location
Salvador-Bahia-Brasil
Equalization appears to have an effect on the modal behavior, perhaps even introducing ringing?

Here's my sub with just using a few simple PEQs:

View attachment 183689

View attachment 183690

Even simple low q minimum phase PEQs seem to cause increased RT (T60M) at certain areas. Altering EQ and SPL levels have an effect seen more often in the bass -- it may improve/worsen the calculated result.

I would compare the group delay. min phase EQ changes phase. if the corrected problem was minmum phase, it can even fix group delay. that's why DRC software uses the mixed-phase aprouch
 

ernestcarl

Major Contributor
Joined
Sep 4, 2019
Messages
3,113
Likes
2,333
Location
Canada
I would compare the group delay. min phase EQ changes phase. if the corrected problem was minmum phase, it can even fix group delay. that's why DRC software uses the mixed-phase aprouch

A simpler, very minimal manual mixed phase correction is pretty much what I do.

The side-effect of equalization in the bass here doesn't alter the GD all that much:

1643829976661.png

I use a steeper HP for the "flat" bass version which increases the GD.


Amplitude difference in comparison:

1643830083739.png

The couch MLP is near the rear wall where bass pressure is at its greatest.

Somehow, neither a flat setting nor boosting and extending the bass causes me the same kind of discomfort you described in your situation.

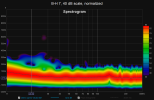
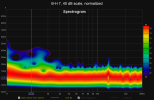
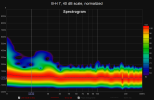
I believe the difference in the spectrograms may indicate why that is (besides personal preference):

1643830404975.png 1643830412854.png 1643830420082.png

At least above 30Hz, there is much less residual energy.
 
OP
caught gesture

caught gesture

Senior Member
Forum Donor
Joined
Feb 19, 2021
Messages
460
Likes
1,023
Location
Italia
I start a thread, then after a while it leads to other people having a conversation and sharing information with each other. This is when I love the internet and a civilised space in which to learn. Thank you @dasdoing in Brasil and @ernestcarl in Canada from me here in Italia.
 

dasdoing

Major Contributor
Joined
May 20, 2020
Messages
4,301
Likes
2,775
Location
Salvador-Bahia-Brasil
I believe the difference in the spectrograms may indicate why that is

yea. my room is 28.09 m3, so it hs the typical small-room bass problem, whih is probably what I am hearing. Your room has significant ringing only below 40Hz, so not that relevant for music
 

dasdoing

Major Contributor
Joined
May 20, 2020
Messages
4,301
Likes
2,775
Location
Salvador-Bahia-Brasil
I start a thread, then after a while it leads to other people having a conversation and sharing information with each other. This is when I love the internet and a civilised space in which to learn. Thank you @dasdoing in Brasil and @ernestcarl in Canada from me here in Italia.

greeting to Italy. I grew up in Germany and we would drive to Italy every third summer or so
 
OP
caught gesture

caught gesture

Senior Member
Forum Donor
Joined
Feb 19, 2021
Messages
460
Likes
1,023
Location
Italia
I just spent the morning making minor adjustments to speaker and sub positions, cross-over frequency changes on the subs, etc. I meticulously recorded and measured each change and finally managed to get this new spectrogram.

3C5AD300-10B2-4FA3-864D-9F226605906D.jpeg


This is an improvement on the last spectrogram that I posted IMO. What caused the biggest change…turning off the sub on the back wall. With just one sub playing there was a smoothing of the response in the room. Here is the previous for comparison purposes.

1A9830CA-DA99-4259-9366-7F52B25FAA63.jpeg


I increased the crossover on the sub to 80Hz as well as moved the mains further from the front wall. I also remeasured with Dirac and am now listening with a number of different curves to see which I prefer.
 

ernestcarl

Major Contributor
Joined
Sep 4, 2019
Messages
3,113
Likes
2,333
Location
Canada
yea. my room is 28.09 m3, so it hs the typical small-room bass problem, whih is probably what I am hearing. Your room has significant ringing only below 40Hz, so not that relevant for music

Yes, there is some ringing even in my flattish EQ esp. between 20-30+ Hz.

Might try switching or converting the bulk of my rear and front treatment to some kind of DIY hybrid limp mass absorber trap. Eventually…
 

ernestcarl

Major Contributor
Joined
Sep 4, 2019
Messages
3,113
Likes
2,333
Location
Canada
I just spent the morning making minor adjustments to speaker and sub positions, cross-over frequency changes on the subs, etc. I meticulously recorded and measured each change and finally managed to get this new spectrogram.

View attachment 184351

This is an improvement on the last spectrogram that I posted IMO. What caused the biggest change…turning off the sub on the back wall. With just one sub playing there was a smoothing of the response in the room. Here is the previous for comparison purposes.

View attachment 184352

I increased the crossover on the sub to 80Hz as well as moved the mains further from the front wall. I also remeasured with Dirac and am now listening with a number of different curves to see which I prefer.

It looks a bit better. What dB scaling are you using? And how about the frequency response — do you think there was some added benefit with the separate front and rear positioning in your room? If not, perhaps putting both in front in an array might work better.
 

ernestcarl

Major Contributor
Joined
Sep 4, 2019
Messages
3,113
Likes
2,333
Location
Canada
Totally forgot, it’s right there in the color scale bars… so 20-1 dB
 
OP
caught gesture

caught gesture

Senior Member
Forum Donor
Joined
Feb 19, 2021
Messages
460
Likes
1,023
Location
Italia
It looks a bit better. What dB scaling are you using? And how about the frequency response — do you think there was some added benefit with the separate front and rear positioning in your room? If not, perhaps putting both in front in an array might work better.
Is this the frequency response that you ask about. The brown line (measurement #17) is without the back sub. Where would I find the dB scaling settings? I’m new to REW, so still finding my way around.

919A0EBD-FD0F-4CD6-B23D-0744FEEE4DEF.jpeg
 

ernestcarl

Major Contributor
Joined
Sep 4, 2019
Messages
3,113
Likes
2,333
Location
Canada
Is this the frequency response that you ask about. The brown line (measurement #17) is without the back sub. Where would I find the dB scaling settings? I’m new to REW, so still finding my way around.

View attachment 184356

“Appearance” button will show another set of settings where you can alter it.

*I think between 25-60 dB range will be the most useful, depending on what you are trying to see. 40 dB seems a good starting average.
 
Last edited:
OP
caught gesture

caught gesture

Senior Member
Forum Donor
Joined
Feb 19, 2021
Messages
460
Likes
1,023
Location
Italia
“Appearance” button will show another set of settings where you can alter it.

*I think between 25-60 dB range will be the most useful, depending on what you are trying to see. 40 dB seems a good starting average.
I don’t see an “Appearance” button. I’m running version 20.4.
 

ernestcarl

Major Contributor
Joined
Sep 4, 2019
Messages
3,113
Likes
2,333
Location
Canada
View attachment 184360
Is this the dB chart that you refer to?

Ex. settings you may want to change and/or take note of:

Desk mains+sub setup focusing on the bass response
1644065598761.png

Why Blackman-Harris 7? I just like how this window type compresses the plotted spectrogram, making it look more compact and a little easier to "read".


1644065605161.png


You can get a similar view of the above above with a much simpler (and smoothed) GD graph:

1644066091958.png


1644066270047.png


1644066860342.png
 
Top Bottom