As everyone else, at the end of the day I really appreciate the effort you're putting here Amir, despite some disagreements. If we complain, it's because we care. I guess some of us will continue to debate, I'll try to keep you out of it directly though. I can understand how it can get tiresome if I were in your position.
Feel free to discuss the methodology for another 20 pages, or 200 or 2000. I am just suggesting to do it elsewhere and not in this thread. I for one am interested in the review but unfortunately couldn't care less about obsessing on the methodology details. Is the parquet in the room red oak, what's the relative humidity of
@amirm ears during measurements? Did he drink red or white wine before measuring?
You can discuss it at will (in another thread please) and when you guys decide that the methodology is good enough let us know
")
Our issue isn't with the general methodology or the klippel, it was for the specific methodology used for this specific speaker, which I would consider not representative of real world use. Ive often emphasized that people take ruler flat frequency response too seriously, but I just feel it's a bit different when there is a big disagreement with known measurements. To use an exaggeration, it'd be kind of like buying a ruler than being okay when you you trace a line that looks like a banana.
To answer some of Amir's questions earlier in the thread without tagging him, a lot of the informationc an be foundon
Neumann's site . It's one of the things I like about them, more data than almost anyone else.
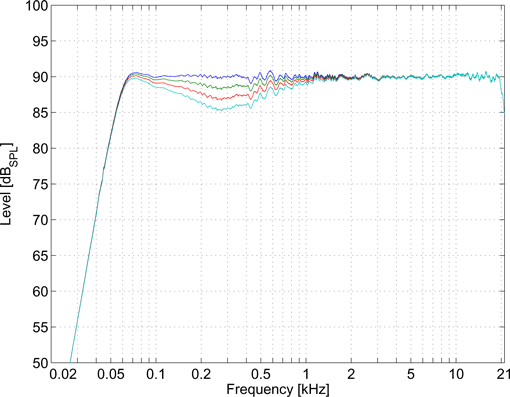
The tolerances were provided earlierin this thread and awware on the Neumann site: 100 percent of speakers produced hit - +/-0.26dB from 100-10Khz, q50 percent 0.17dB. Each speaker is checked for calibration as one of the final steps.
The frequency response linearity is given as +/-0.7dB from 100 to 10KHz.
Max Bass SPL is given at 92.1dB which again, explains the bass droop at the tested volume of 95.5dB @1m, which is too loud =]
'Interpolated' I'm 90 percent sure is an average of several measurements. If you look at this other graph detailing the low-mid controls, it gives what appears to be a bit more variation for the basic on-axis curve from a single measurement session. Just a bit more jagged than the interpolated one.
I think people are making a mountain out of a molehill here, changing the drive level to be the recommended 2.83V for passive and 79db @ 2m for active is a simple adjustment that I think should be made but it shouldn't change the measurements that much.
My bigger disagreement is about the manufacturer's "suggested" axis, or in other words the axis that will create the prettiest graph. Revel suggests 7" above the tweeter axis for the M126be, my question is why? Most people place bookshelf speakers with the tweeter axis close to ear level so why wouldn't we measure that way? I say Amir picks either the tweeter axis or half-way between the tweeter and midrange and sticks with that for consistency. I think most of us want honest, accurate results more than pretty graphs.
Firstly, I don't think a studio monitors are the same as home speakers. When you set up a studio monitors, you're going for accuracy. You read the manual. And in the nearfield, the direct sound has a much larger impact than in the living room.
Seriously, Neumann even gives you a little printout you can use to angle your speakers correctly. They even
precisely define the acoustical axis for each speaker (PDF):
"The acoustical axis is a line normal to the loudspeaker’s front panel along which the microphone was placed when tuning the loudspeaker’s crossover during design. Pointing the acoustical axis, in the horizontal and vertical planes, towards the listening position or center of the listening area will give the best measured and perceived sound quality. "
I'm fine with someone not caring about it, but I would disagree that it's not important to optimize the correct acoustical axis.
Most important: you use the reference axis because it's supposed to sound the best. The "prettiest" graph, given good directivity, *is* the best sounding graph. Mind you, it's not always the case the reference axis is the best axis, but I do find it bizarre that this is in contention.
Following this logic we should also not measure speakers at the symmetrical horizontal axis either, because according to studies, the average listener listens off axis
. I've seen anywhere from 10-20 quoted. The average was 10 degrees off axis in devantier, 2002. 20 degrees off axis was almost as common as on axis =].
