For towers there’s is no way low frequency measurements below 80Hz will ever represent what you experience at home. It’s almost misleading because outside of the anechoic chamber, bass response is completely dependent on room interaction. I do agree that scoring of FR above 200Hz should be reported separately.What say you about people that don’t want a subwoofer (or a certain someone won’t allow one), but they can choose between bookshelves or towers?
If a secondary list for subwoofer users (with actual crossovers) were made where LFX is disregarded (14.5Hz used), then that would of course be fine; but the main ranking list should stay as is (or improved).

-
WANTED: Happy members who like to discuss audio and other topics related to our interest. Desire to learn and share knowledge of science required. There are many reviews of audio hardware and expert members to help answer your questions. Click here to have your audio equipment measured for free!
You are using an out of date browser. It may not display this or other websites correctly.
You should upgrade or use an alternative browser.
You should upgrade or use an alternative browser.
Speaker Equivalent SINAD Discussion
- Thread starter MZKM
- Start date
It would be very nice if this particular thread could be limited to the actual topic due to the significance of it.
If you have any concern or see any problem with a simplified ranking system and feel the need to express it, please be so kind and suggest a solution to it as well. Otherwise it's all noise.
If you have any concern or see any problem with a simplified ranking system and feel the need to express it, please be so kind and suggest a solution to it as well. Otherwise it's all noise.
The thing I wanted to say is this: SINAD (together with APP standard screen data) servers as quite good indicator of how well DAC/amp has been engineered, but not really how those devices sound as some of them that have low SINAD value would still have decent SQ in terms of transparency. Toole's research, on which Klippel's graph are based, was focused on speakers SQ and not how well speakers are engineered. The thing I wanted to point out is that people are pushing THD into speakers metrics alhtough Toole's research says it is pretty much irrelevant and that fact is hard to swallow for a typical forum member.
Regarding the speakers charts: maybe least square linear regression can be applied on those 6 curves whicw will take into account how linear they are but also the angle they run at for the 2 index charts?
Regarding the speakers charts: maybe least square linear regression can be applied on those 6 curves whicw will take into account how linear they are but also the angle they run at for the 2 index charts?
It would be very nice if this particular thread could be limited to the actual topic due to the significance of it.
If you have any concern or see any problem with a simplified ranking system and feel the need to express it, please be so kind and suggest a solution to it as well. Otherwise it's all noise.
@restorer-john has done that and had the old management 'I-don't-want-to-hear-it' treatment.
- Joined
- Feb 23, 2016
- Messages
- 20,946
- Likes
- 38,060
Now having had some time to read thru Olive's Multi-regression paper, why wouldn't you use the Anechoic PIR (predicted in room response) equation upon the Klippel data? It appeared to correlate the best to actual results over the larger group of 70 speakers tested. You'd get a single preference rating for it.
The actual in room measured performance wasn't far behind. Which gives hope to measuring such things in your own listening room.
@MZKM @amirm
The actual in room measured performance wasn't far behind. Which gives hope to measuring such things in your own listening room.
@MZKM @amirm
OP
- Thread Starter
- #86
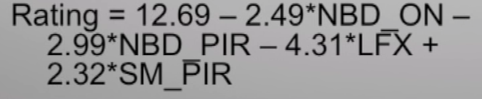
Am I not understanding your question, because it's used in the formula:why wouldn't you use the Anechoic PIR (predicted in room response) equation upon the Klippel data? It appeared to correlate the best to actual results over the larger group of 70 speakers tested. You'd get a single preference rating for it.
- Joined
- Feb 23, 2016
- Messages
- 20,946
- Likes
- 38,060
Yes, I was wondering why all the wondering otherwise. Seems that is the one to use. I wasn't implying something different than what is in your original post. Seems the best supported by the data.Am I not understanding your question, because it's used in the formula:
From there other concerns like difficult impedance, power handling/efficiency, size, cost could be ancillary factors to be considered.
Here, the situation is far, far better than using SINAD. The work by Sean Olive is 100% based on double blind controlled testing to make sure the score correlates with listening test results. This is no simple measurement from 50 years ago that SINAD is. Here are some bits from the paper:
A Multiple Regression Model for Predicting
Loudspeaker Preference Using Objective
Measurements: Part II - Development of the Model
Sean E. Olive, AES Fellow
View attachment 45625
Correlation of 1.0 means perfection. That the model predicts listening test results with 100% accuracy. Here is the actual graph relative to results:
View attachment 45626
As you see the experimental results closely hug the linear prediction.
View attachment 45627
And how the tests were conducted:
View attachment 45628
If this kind of scoring is not good enough for you all, I don't know what is. This research is a gift. I highly suggest reading it in detail before scuffing at it.
And it is not like we can go without. I just measured another speaker that i will post soon. I am sitting here, seeing some anomalies in the measurements but no way of characterizing it at all in relative scale to what I have measured before.
At the end, the scale may just be good for showing the best and the worst. This is what SINAD is doing and is a great service and outcome. I don't care if someone argues between a speaker that gets a score of 6 or 7. I care about clearly identifying the dogs and heros.
As with speaker testing, there are many reasons not to do something. Get on board to solve this problem. The consumer needs a scale. It doesn't have to be perfect. It is not like he has any scale whatsoever to use right now. A compass is not as good as GPS but it can sure tell you more or less which way to walk if you are lost.
Agreed. Sean Olive's predicted preference ratings from this paper, based on anechoic measurements, have a 0.86 correlation (1 being perfect) with the actual preference ratings of 70 speakers, of a wide range of types, sizes, prices and brands. Honestly, that's amazingly accurate, and is actually based on decades of confirmed science in acoustics and psychoacoustics, by leaders in their field, as well as solid statistics (the importance of which should not be underestimated for science). I don't think we're going to find anything better at the moment, without more actual scientific research being done. Consider that Consumer Reports ranked speakers for over 30 years using a model that produced ratings with a negative correlation of -0.22 with actual preference ratings in blind tests, as Sean Olive also showed in this paper. So the better sounding a speaker was, the lower they ranked it. ASR using Olive's model would be quite the improvement! And a fantastic resource for consumers. (Other metrics like THD can be measured and presented, but I don't believe they sould be incorporated into Olive's rating ad-hoc, as research shows distortion plays a very small role in subjective preferences of speakers, as Olive states in his paper.)
That being said, it has to be carefully considered that Olive's model was optimised to give higher predicted preference ratings to speaker systems with lower bass extension, as these give the highest actual preference ratings. This is evidenced by the LFX (low Frequency Extension) variable in Olive's formula having a major weighting (close to a third) of the total preference rating. Full-range tower speakers and (even more so) speakers used with subwoofers tend to have the lowest bass extension. This leads to a problem when ranking e.g. bookshelf speakers or small monitors on their own, which are often designed to work best with a subwoofer, and will be considered by users who often already have a sub. Olive's formula will give skewed ratings for these speakers that are not full-range but will be used with a sub, which will not be representative of the actual preference rating they would receive in a 2.1 set-up.
I suggest then having two ratings, one for each of the two major set-ups: speakers used on their own, and speakers used with a subwoofer. The first set-up can be ranked using Olive’s original formula as is. The second set-up can be ranked with a maximum potential preference rating – what preference rating the speaker would score if it were used with an ideal subwoofer. From Olive’s formula, an ideal speaker with the maximum preference rating would need to have NBD_ON = NBD_PIR = 0 and SM_PIR = 1 i.e. zero narrow-band deviations in on-axis and predicted in-room response, and perfect smoothness in the latter. As this fixes all variables but LFX, from this we can calculate the LFX value that would produce a maximum score of 10 (thanks to @MZKM for pointing out the max score is likely 10). Rearranging the formula this works out at LFX(ideal) = 1.16. From Olive's definition of LFX:
So LFX(ideal) = log10(x_SP(ideal)), and therefore:LFX is the log10 of the first frequency x_SP below 300 Hz in the sound power curve, that is -6 dB relative to the mean level y_LW measured in listening window (LW) between 300 Hz-10 kHz.
x_SP(ideal) = 10^LFX(ideal) = 10^1.16 ≈ 14.5 Hz
This seems bang-on for an ideal subwoofer. A -6 dB point that low means it should easily reach 0 dB relative to the mean listening window amplitude by 20 Hz, the lower limit of audibility. Now we have our ideal subwoofer extension that would give us the maximum score of 10 for Olive’s preference rating (when paired with ideal speakers), we can plug this lower extension of 14.5 Hz (and so LFX value of 1.16) into the formula, and combine this with the actual measured narrow-band deviations in on-axis and predicted in-room response and smoothness of any measured speaker to give an accurate potential preference rating when it’s used with an ideal sub, in order to rank speakers for the large group of people who use 2.1 systems for listening to music (or even home theatre). This can be presented in conjunction with the original preference rating using the actual LFX of the speaker measured, for people who do not use and don’t intend to get a subwoofer.
Last edited:
I like your proposal. The only thing is whether we should use an ideal sub or test some and use their score. The ideal sub situation may disadvantage a full range speaker that doesn't by definition have ideal bass response down to -6 dB of 14 Hz.
Whatever the measurements say let me add a personal subjective experience: My living room has a hard reflecting floor and I have a medium thick carpet between LP and speakers. Otherwise the rooms acoustic is quite dry.The FHG test is valid but is far from universally representative of hif-fi playback. For example, reproduction of an anechoically recorded voice via a loudspeaker no doubt sounds more realistic with the floor reflection included upon playback, given listener expectation. It's far from established that symphonic works would be similarly better served with local floor reflection present. The floor reflection doesn't exist with these time stamps or characteristics in a live symphonic event. A similar argument can be made for a live recording where the recording environment's floor reflection is already present (though the spatial component is admittedly missing). I don't believe Dr Toole or Harman ever studied this.
Carpet doesn't reduce the floor reflection in a timbre-neutral way given its effect is limited towards higher frequencies. Side wall absorption is often detrimental since its effect is not broad band, and this (can) distort the perceived timbre in room. Since the floor reflection has a much greater impact on perceived timbre than side wall (see Bech), I think the same argument applies even more strongly to the floor reflection. Maybe its better to leave the floor reflection in all together, or deal with its effect through carpet (mid/high freq) + DSP (lower freq)
I was mistaken, I've collected 40+ papers (gulp, why do I do this to myself
Once I removed the carpet to prevent party guests spilling drinks on it. The morning after I started listening to music without the carpet and the sound was just horrible (kind of flutter echoes). At once I put the carpet back in place and all was fine. So I'd say even if the reduction of reflections is not timbre-neutral it is much better than no reduction.
OP
- Thread Starter
- #91
Many people crossover their towers with subs as well.I like your proposal. The only thing is whether we should use an ideal sub or test some and use their score. The ideal sub situation may disadvantage a full range speaker that doesn't by definition have ideal bass response down to -6 dB of 14 Hz.
Many good subs get that deep, as that means it’s flat down to 20Hz. Rythmik’s cheapest sealed sub, the L12 (<$600) is rated at 12Hz -6dB. Rythmik’s largest single-woofer, their F18 (~$1650) is rated at 14Hz -2dB, and is measured here; the validity/accuracy could be questioned, but it’s decently close to spec.
So they will then complain why we don't score them with subs.Many people crossover their towers with subs as well.
I like your proposal. The only thing is whether we should use an ideal sub or test some and use their score. The ideal sub situation may disadvantage a full range speaker that doesn't by definition have ideal bass response down to -6 dB of 14 Hz.
My proposal is to provide the two ratings, for use with and without a subwoofer, for all speakers, including full-range towers. Then the consumer can just look at the rating that corresponds to their set-up. No speakers would be disadvantaged this way. I think an ideal sub would work best here, as then the rating would act as a 'maximum potential rating' for any particular speaker (as well as working out mathematically with Olive's model, meaning an ideal LFX of 14.5 Hz would give a perfect 10 score using ideal speakers).
Last edited:
Oh. Then that would work.My proposal is to provide the two ratings, for use with and without a subwoofer, for all speakers, including full-range towers. Then the consumer can just look at the rating that corresponds to their set-up. No speakers would be disadvantaged this way.
- Joined
- Feb 23, 2016
- Messages
- 20,946
- Likes
- 38,060
I might propose going the other way. The correlation for bookshelf speakers was higher. And despite any anechoic performance, you have trouble getting smooth in room response due to modes. I'd propose some arbitrary roll off of full range models to allow comparing with bookshelf, monitor or stand mounted speakers. 2nd order roll off at 100 hz maybe. So you show full range rating, and truncated low end rating for full range models. Then if someone wishes they can see how their smaller speaker compares without a low end, and always add it with subs if they care to do so.I like your proposal. The only thing is whether we should use an ideal sub or test some and use their score. The ideal sub situation may disadvantage a full range speaker that doesn't by definition have ideal bass response down to -6 dB of 14 Hz.
xr100
Addicted to Fun and Learning
For subwoofers (and I have yet to read through/digest the referenced literature, so please forgive me if I've missed something)--it seems to me that it would be useful to consider possible unwanted "localisation" to the subwoofer location, e.g. excessive harmonic distortion, port chuffing, etc.
I might propose going the other way. The correlation for bookshelf speakers was higher. And despite any anechoic performance, you have trouble getting smooth in room response due to modes. I'd propose some arbitrary roll off of full range models to allow comparing with bookshelf, monitor or stand mounted speakers. 2nd order roll off at 100 hz maybe. So you show full range rating, and truncated low end rating for full range models. Then if someone wishes they can see how their smaller speaker compares without a low end, and always add it with subs if they care to do so.
Changing the actual definition of the variables in Olive's algorithm like that is not straightforward, and we have no idea how that would affect their correlation with actual preference ratings. Also, note there were only 13 speakers in the bookshelf speaker test - lower samples sizes are usually likely to lead to a better fitting model when using multiple regression analysis.
If @amirm posts the calculated values of all the four variables in Olive's formula (NBD_ON, NBD_PIR, SM_PIR and LFX) for each speaker measured, in addition to the two main ratings for with and without a subwoofer, more niche comparisons can be done by the reader themselves (in your case you could disregard the LFX variable, as the other three only use data from 100 Hz upwards anyway).
DDF
Addicted to Fun and Learning
- Joined
- Dec 31, 2018
- Messages
- 617
- Likes
- 1,362
Whatever the measurements say let me add a personal subjective experience: My living room has a hard reflecting floor and I have a medium thick carpet between LP and speakers. Otherwise the rooms acoustic is quite dry.
Once I removed the carpet to prevent party guests spilling drinks on it. The morning after I started listening to music without the carpet and the sound was just horrible (kind of flutter echoes). At once I put the carpet back in place and all was fine. So I'd say even if the reduction of reflections is not timbre-neutral it is much better than no reduction.
Flutter echos are terrible, but are symptomatic of very parallel walls. I once had an IEC room built and the contractor, knowing it was a special audio research room, directed the builders to make the walls extremely parallel mistakenly thinking that this would help the acoustics. The flutter echoes were almost unmanageable and required significant wall treatment to quell. However, I didn't take that as a justification for eradicating drywall as a wall material.
If you have flutter echoes, by all means treat it any way possible, but that's a corner case condition requiring specific treatment and not a universal justification for carpet.
I get none of the flutter echo issues in my room, with oak flooring. I've also had fully carpeted floors and the sound was deader. But none of that matters, they're just my observations.
Your observations are interesting but no different than any other uncontrolled single person observations (as are mine). I don't think we can have it both ways: deferring to personal observations when we can't argue the science, and then demand science when we dislike others personal observations.
I've seen no one here argue with the premise from Dr. Toole that frequency dependent reflections are bad (so, avoid narrow band absorption). The DBTs also show that reflections from floor have highest impact on timbre. So why should it be ideal to use just a thin, highly frequency dependent absorption on the floor?
Maybe we're just adapted to it, or conditioned to think its "better" with no frame of reference? Or maybe, its per the mixing desk environment where even unbalanced absorption allows easier detection of fine detail (suiting the mixing task at hand, and perceived as a change so an "improvement" in the home), but isn't neutral?
But I go back to my original comment: for symphonic, logically its best that the floor reflection be gone but its not by any means settled science that a carpet is better than nothing, assuming no obvious corner case flutter echoes. Arguing for carpet is logically the same as arguing the case for thin side wall absorption.
Last edited:
OP
- Thread Starter
- #99
Most subwoofers only apply amplification towards its operational frequencies, so you really only get THD in subs below ~40Hz, so there are no harmonics of say 70Hz that are getting through.For subwoofers (and I have yet to read through/digest the referenced literature, so please forgive me if I've missed something)--it seems to me that it would be useful to consider possible unwanted "localisation" to the subwoofer location, e.g. excessive harmonic distortion, port chuffing, etc.
Port chuffing only occurs once a certain SPL is met, it shouldn’t happen at nominal listening levels (unless it’s very underpowered).
The main cause for localization is simply having a dead room. I can rarely locate my subwoofer in my wooden floor living room, but it’s easy to locate my sub in my carpeted bedroom (bed absorbs a lot too).
Going dual (or more) will get rid of localization.
Last edited:
Not a thin one. Recommendation is to get a shaggy carpet with thick breathable underlayment. Mine is probably 3 inches thick which is quite broadband without it being a trip hazard.So why should it be ideal to use just a thin, highly frequency dependent absorption on the floor?
Similar threads
- Replies
- 345
- Views
- 52K
- Replies
- 11
- Views
- 1K
- Replies
- 255
- Views
- 42K
- Replies
- 1
- Views
- 303