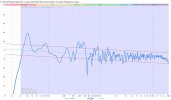
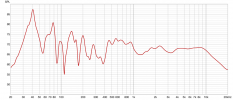
Looks pretty good.
A few tips for posting frequency response graphs on ASR:
-use a roughly 50dB vertical range. Substantially more than that just compresses the graph and makes it harder to read.
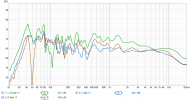
-for in-room response response measurements, use Var smoothing.
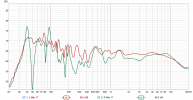
-use REW's light mode for graphs, as they're substantially easier to read (better contrast). In REW's latest beta, you can keep the program in dark mode, but choose light mode only when exporting graphs via the Capture tool (camera symbol).
Otherwise, you'll have to switch to Light mode in REW's View preferences.
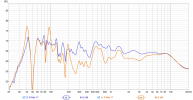
-if you'd rather not bother with the Capture tool, then you can hide the cursor with Ctrl+Shift+H. That way, regular screenshots will be a bit more tidy.


")