Mentalrudy
Member
- Joined
- Oct 31, 2020
- Messages
- 27
- Likes
- 6
Hi everyone,
I'm mystified by the measurements I've added here.
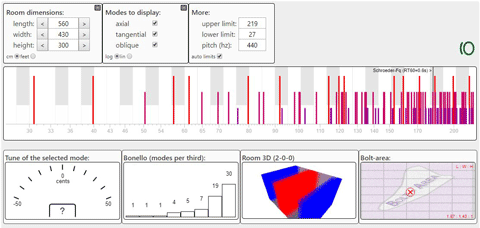
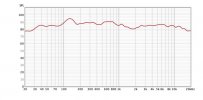
Some context: I've had horrible bass response in my room and consulted a professional accoustical firm (that works for studio's, broadcast stations etc) to fix it as much as possible with room treatments. Now, pic 1 & 2 are the result of the professional measurements after the treatment. Seems perfect, but alas: I still hear huge bass dips, confirmed when I run a bass sweep and check with a spl-db meter.
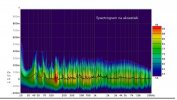
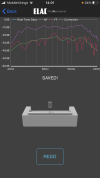
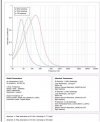
Now, since I'm not technically adept I haven't tried working with REW myself and I don't own a calibrated usb mic, I can't really verify his measurements. But when I tried a Elac sub which has autoEQ, the measurements (via Iphone mic) showed up in the app as you can see on pic 3, where blue is the nearfield response of the sub and the red line is the response at listening position.
This graph resembles more what I'm hearing.
This looks to me as if someone is fraudulent. Or could it be the case that the large difference in the two graphs are explained by teh first being a easurement with calibrated mic, pink noise and rew and the second is just a phone measurement with the elac app? Seems unconvincing.
I'm mystified by the measurements I've added here.
Some context: I've had horrible bass response in my room and consulted a professional accoustical firm (that works for studio's, broadcast stations etc) to fix it as much as possible with room treatments. Now, pic 1 & 2 are the result of the professional measurements after the treatment. Seems perfect, but alas: I still hear huge bass dips, confirmed when I run a bass sweep and check with a spl-db meter.
Now, since I'm not technically adept I haven't tried working with REW myself and I don't own a calibrated usb mic, I can't really verify his measurements. But when I tried a Elac sub which has autoEQ, the measurements (via Iphone mic) showed up in the app as you can see on pic 3, where blue is the nearfield response of the sub and the red line is the response at listening position.
This graph resembles more what I'm hearing.
This looks to me as if someone is fraudulent. Or could it be the case that the large difference in the two graphs are explained by teh first being a easurement with calibrated mic, pink noise and rew and the second is just a phone measurement with the elac app? Seems unconvincing.
 Happy hunting.