
Hi, it's been a while!
I would like to thank the people who made this project possible on a scale never before imagined in South Korea. I measured a total of 10 subwoofers, including my own DIY subwoofer(L26RO4Y), and measured them to the CEA-2010 standard using a Klippel TBM module. Below are photos and a list of the subwoofers I measured.

(In order from left to right)
- Arendal 1961 1V
- Arendal 1961 1S
- Neumann KH750
- Bowers & Wilkins DB4S
- SVS SB-3000
- SVS SB-2000 pro
- SVS SB-1000 pro
- Polk audio PSW111
- My DIY Subwoofer
- SVS 3000 micro
This is officially the first time CEA-2010 has been measured in South Korea.
So there was a lot of trial and error, which took a lot of time.
And for the products that were not loaded enough, I did a second measurement under slightly harsher conditions with the owner's permission, and added data.


With that out of the way, let's get down to business, releasing data starting with the SVS SB-1000 pro model.
All subsequent data will be presented in the same format, with the only difference being the product name.
As I'll explain later, there are a lot of variables in active subwoofers, so it's not possible to compare products on a fixed basis.
SVS SB-1000 pro

-21.2dBu means that we measured with an input of 80dB SPL@2m (100Hz) and an output of 80dB SPL@2m (100Hz).
(I state this because it can vary depending on the volume and gain knob settings on the product).
THD


Group delay


ETC

Measure the attenuation level for 100ms after the peak (0dBFS).
Higher attenuation is considered ideal.

Now it's finally time to measure the TBM module. First, let's take a moment to explain how the TBM module works.
The TBM module measures a preset frequency, one cycle for each voltage, gradually increasing the voltage. If the THD value of the measured signal exceeds the threshold, it moves on to the next frequency. In other words, if you measure 20 Hz and the THD crosses the threshold, you move on to the next measured frequency, 25 Hz.
This is where the start voltage and maximum voltage settings become very important. The reason for this is that if you make the measurement too harsh, you risk damaging certain products, and if you make it too soft, you lose discrimination between products. Unfortunately, since I had to measure 10 subwoofers in one day with a lot of trial and error, I couldn't find the optimal measurement level for each product.
Therefore, I only set the minimum input gain and SPL for each product, and then replicated the rest of the conditions and measurement module settings.
So keep in mind that what may seem like an advantage for some products may not work for others.
However, please understand that we had to take this conservative approach because protecting the product is our number one priority.

The following introduces the THD thresholds for each frequency in this module.
According to the CEA-2010B standard, there are different THD thresholds for each frequency.
The two thresholds above indicate that,
If you don't intuitively understand what this means, it means that there are different values of acceptable THD for each measurement frequency!
In other words, at lower frequency measurements, we're more forgiving, but as we move to higher frequencies, we get stricter about THD.
And this applies as follows

If the THD of the measured signal is all below the threshold, the corresponding frequency measurement is PASS!

If any of them touch the threshold, that measurement will FAIL!
And if it fails, then we just move on to the next frequency measurement,
We have a threshold level, called [Neglect Threshold Below], that determines if we should try to resume the measurement with a higher voltage.
For this measurement, it doesn't matter much because I mostly set this value equal to the maximum voltage.
In other words, even if it fails, it tries to increase the level unconditionally up to the preset value.
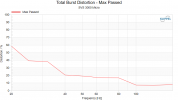
Peak Value

If you've never seen this plot before, you might be confused.
Basically, the more closely spaced the frequencies, the better the effective bandwidth, and the straighter the line, the better the output.
However, each subwoofer has a different preset output value from the manufacturer, so it's not a perfect comparison.


Looking at this data, you should see some of the PASS! and FAIL! we discussed earlier.
The orange ones at relatively low voltages are the ones where background noise has crossed the THD threshold, so if you see green values at higher outputs, you can ignore anything below that.
(This is where the sophisticated 'Neglect Threshold below' setting comes in).
The first thing to look at is the top green value for each frequency.
That's the maximum output of that subwoofer, at least for the current measurement.
But that's not all.
Each measured signal increases by exactly 1 dB,
There are many instances where the actual measured SPL value is less than 1 dB, even at frequencies where a passing score is achieved.
In other words, the THD didn't touch the threshold in the 2010B standard, but it was already eating up compression in the lower range.
This is where you need to be proactive in your interpretation of each product.


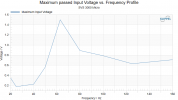
The maximum voltage that the product can accept in the current measurement setup.
(More precisely, the voltage it can take within the limits of its normal output.)

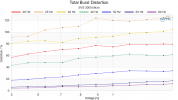
THD% at the PASSed point for each frequency.

THD% by output.
Each frequency is color coded.
I hope you enjoy these measurements.
I'll leave you with the data for the remaining nine subwoofers in order, along with their names.
+++++
I apologize for not attaching a more detailed description and evaluation of the data and plots.

I would like to thank the people who made this project possible on a scale never before imagined in South Korea. I measured a total of 10 subwoofers, including my own DIY subwoofer(L26RO4Y), and measured them to the CEA-2010 standard using a Klippel TBM module. Below are photos and a list of the subwoofers I measured.
(In order from left to right)
- Arendal 1961 1V
- Arendal 1961 1S
- Neumann KH750
- Bowers & Wilkins DB4S
- SVS SB-3000
- SVS SB-2000 pro
- SVS SB-1000 pro
- Polk audio PSW111
- My DIY Subwoofer
- SVS 3000 micro
This is officially the first time CEA-2010 has been measured in South Korea.
So there was a lot of trial and error, which took a lot of time.
And for the products that were not loaded enough, I did a second measurement under slightly harsher conditions with the owner's permission, and added data.
With that out of the way, let's get down to business, releasing data starting with the SVS SB-1000 pro model.
All subsequent data will be presented in the same format, with the only difference being the product name.
As I'll explain later, there are a lot of variables in active subwoofers, so it's not possible to compare products on a fixed basis.
SVS SB-1000 pro
-21.2dBu means that we measured with an input of 80dB SPL@2m (100Hz) and an output of 80dB SPL@2m (100Hz).
(I state this because it can vary depending on the volume and gain knob settings on the product).
THD
Group delay
ETC
Measure the attenuation level for 100ms after the peak (0dBFS).
Higher attenuation is considered ideal.
Now it's finally time to measure the TBM module. First, let's take a moment to explain how the TBM module works.
The TBM module measures a preset frequency, one cycle for each voltage, gradually increasing the voltage. If the THD value of the measured signal exceeds the threshold, it moves on to the next frequency. In other words, if you measure 20 Hz and the THD crosses the threshold, you move on to the next measured frequency, 25 Hz.
This is where the start voltage and maximum voltage settings become very important. The reason for this is that if you make the measurement too harsh, you risk damaging certain products, and if you make it too soft, you lose discrimination between products. Unfortunately, since I had to measure 10 subwoofers in one day with a lot of trial and error, I couldn't find the optimal measurement level for each product.
Therefore, I only set the minimum input gain and SPL for each product, and then replicated the rest of the conditions and measurement module settings.
So keep in mind that what may seem like an advantage for some products may not work for others.
However, please understand that we had to take this conservative approach because protecting the product is our number one priority.
The following introduces the THD thresholds for each frequency in this module.
According to the CEA-2010B standard, there are different THD thresholds for each frequency.
The two thresholds above indicate that,
If you don't intuitively understand what this means, it means that there are different values of acceptable THD for each measurement frequency!
In other words, at lower frequency measurements, we're more forgiving, but as we move to higher frequencies, we get stricter about THD.
And this applies as follows
If the THD of the measured signal is all below the threshold, the corresponding frequency measurement is PASS!
If any of them touch the threshold, that measurement will FAIL!
And if it fails, then we just move on to the next frequency measurement,
We have a threshold level, called [Neglect Threshold Below], that determines if we should try to resume the measurement with a higher voltage.
For this measurement, it doesn't matter much because I mostly set this value equal to the maximum voltage.
In other words, even if it fails, it tries to increase the level unconditionally up to the preset value.
Peak Value
If you've never seen this plot before, you might be confused.
Basically, the more closely spaced the frequencies, the better the effective bandwidth, and the straighter the line, the better the output.
However, each subwoofer has a different preset output value from the manufacturer, so it's not a perfect comparison.
Looking at this data, you should see some of the PASS! and FAIL! we discussed earlier.
The orange ones at relatively low voltages are the ones where background noise has crossed the THD threshold, so if you see green values at higher outputs, you can ignore anything below that.
(This is where the sophisticated 'Neglect Threshold below' setting comes in).
The first thing to look at is the top green value for each frequency.
That's the maximum output of that subwoofer, at least for the current measurement.
But that's not all.
Each measured signal increases by exactly 1 dB,
There are many instances where the actual measured SPL value is less than 1 dB, even at frequencies where a passing score is achieved.
In other words, the THD didn't touch the threshold in the 2010B standard, but it was already eating up compression in the lower range.
This is where you need to be proactive in your interpretation of each product.
The maximum voltage that the product can accept in the current measurement setup.
(More precisely, the voltage it can take within the limits of its normal output.)
THD% at the PASSed point for each frequency.
THD% by output.
Each frequency is color coded.
I hope you enjoy these measurements.
I'll leave you with the data for the remaining nine subwoofers in order, along with their names.
+++++
I apologize for not attaching a more detailed description and evaluation of the data and plots.
Last edited:
")