- Joined
- Apr 24, 2019
- Messages
- 1,501
- Likes
- 2,822
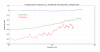
I hope this isn’t too OT, a reality check on phono performance. This is a plot of a constant velocity 500Hz -50kHz sweep on a high-quality test LP (the TT setup here is from member JP and far beyond anything I have). We put together this Python script to display amplitude and the first two harmonics from a .wav file.
After looking at a lot of test LP’s and different frequency response tracks this clearly has the least number of unknown variables. A constant amplitude on the cutter head is reciprocal to an ideal constant velocity transducer, this eliminates RIAA conformance on both sides of the equation. So this is a true test of a cartridge’s frequency response.
As for frequency response this is one of the best I have seen, the harmonics speak for themselves. The flattening at the low end indicates that this is as good as it gets though as amplitude decreases the distortion will too.
I would gladly send the script to anyone that wants it, it runs out of the box with any Python install that includes the important signal processing and math modules, Anaconda for instance.