I was surprised the microphones ended up so close to the Umik1 calibrated mike. Especially that all three omnis matched so closely. Even more so when you read how I calibrated these other microphones.
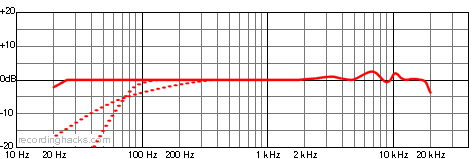
I simply grabbed graphs of the response from the makers and created calibration files for REW from those. Such graphs are maligned for being smoothed and being written by the marketing guys. Especially one like this for the Shure KSM 32. They were a little optimistic below 100 hz, but apparently these kinds of response graphs are for real.
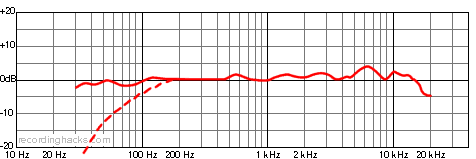
Some are more bumpy like for the Audio Technica At4033a. Yet when corrected based upon this the results line up well when an uncorrected graph would be considerably different.
I have pairs of most of these other microphones. Another surprising result is each pair though some were made years apart drop on top of each other almost identically. The difference being about equal to what you might get running the test twice on one microphone a few minutes apart.
If you ever have reason to make your own cal files for REW, WebPlotDigitizer is free software that makes it a piece of cake.
http://arohatgi.info/WebPlotDigitizer/
It runs as a Chrome add on, or in a browser window, or an app in Chrome OS or a downloaded offline version for Windows.
I can grab an image of the graph and spit out a .csv cal file in two minutes or less. REW takes .csv as well as .txt files for calibration.
Take a few minutes to learn the software and it is pretty handy. You open an image file. Pick two points on the x axis and on the y axis. Select linear or log scaling. Set the size of the scales. Then you have two choices. You can use a mouse to place points on the curve as many as required to follow the curve. If you can find graphs like those above where the curve of interest is a different color than the grid it is even easier. You take a paint brush and paint a wide line over the curve, then use a color picker. The software then places plenty of points on the curve of that color and spits out a file with the values in the .csv format ready to drop straight into REW as a cal file. It is easier than it sounds. There are a couple of 9 minute youtube tutorials by the author of the software. The software also can do much more like polar graphs or mapping.
Recording hacks is a good place to find graphs for nearly any microphone all in one location. They have a fairly extensive listing of microphones with descriptions, basic specs and usually graphs of response.
http://recordinghacks.com/microphones/

") Thanks for all the work. It is so easy to make mistakes and posting them online is a good way to find such faults.
Thanks for all the work. It is so easy to make mistakes and posting them online is a good way to find such faults.